

Question: The following represents pressure samples, in pounds per square inch (psi), taken in a fuel line once every second for 10 sec. a. Fit a
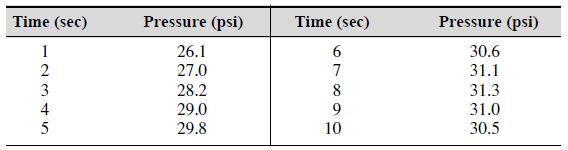
The following represents pressure samples, in pounds per square inch (psi), taken in a fuel line once every second for 10 sec.
a. Fit a first-degree polynomial, a second-degree polynomial, and a third-degree polynomial to these data. Plot the curve ts along with the data points.
b. Use the results from part a to predict the pressure at t = 11 sec. Explain which curve t gives the most reliable prediction. Consider the coefficients of determination and the residuals for each t in making your decision.
Time (sec) Pressure (psi) Time (sec) Pressure (psi) 26.1 27.0 1 6. 30.6 2 7 31.1 3 28.2 8 31.3 4 29.0 9 31.0 29.8 10 30.5
Step by Step Solution
3.43 Rating (162 Votes )
There are 3 Steps involved in it
Lets go through the steps to solve the problem Part a Fit Polynomials 1 Data points Time sec 1 2 3 4 5 6 7 8 9 10 Pressure psi 261 270 282 290 298 306 ... View full answer

Get step-by-step solutions from verified subject matter experts