

Question: Consider the following table comparing the grade point averages (GPAs) and mathematics SAT scores of high school students in 1988 and 1998 (before the SAT
Consider the following table comparing the grade point averages (GPAs) and mathematics SAT scores of high school students in 1988 and 1998 (before the SAT test format was revised).
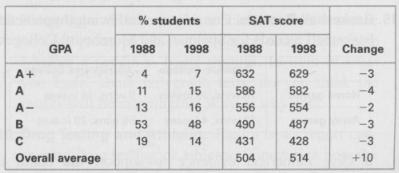
a. In general terms, how did the SAT scores of the students in the five grade categories change between 1988 and 1998?
b. How did the overall average SAT score change between 1988 and 1998?
c. How is this an example of Simpson's paradox?
% students SAT score GPA 1988 1998 1988 1998 Change A+ 7 632 629 15 586 582 16 556 554 48 490 487 14 431 428 504 514 13 53 19 Overall average +10
Step by Step Solution
3.48 Rating (171 Votes )
There are 3 Steps involved in it
a The SAT scores in all five grade categories declined bet... View full answer

Get step-by-step solutions from verified subject matter experts
Document Format (1 attachment)
666-M-S-D-A (5686).docx
120 KBs Word File