

Crane Plastics Company has provided the following comparative information: You have been asked to evaluate the historical
Question:
Crane Plastics Company has provided the following comparative information:
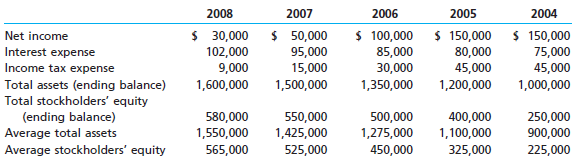
You have been asked to evaluate the historical performance of the company over the last five years.
Selected industry ratios have remained relatively steady at the following levels for the last five years:
2004–2008
Rate earned on total assets ..........7%
Rate earned on stockholders’ equity .....20%
Number of times interest charges earned ...3.0
Ratio of liabilities to stockholders’ equity ....2.0
Instructions
1. Prepare four line graphs with the ratio on the vertical axis and the years on the horizontal axis for the following four ratios (rounded to two decimal places):
a. Rate earned on total assets
b. Rate earned on stockholders’ equity
c. Number of times interest charges earned
d. Ratio of liabilities to stockholders’ equity
Display both the company ratio and the industry benchmark on each graph. That is, each graph should have two lines.
2. Prepare an analysis of the graphs in (1).
Step by Step Answer:
1 a 1 b 1 c 1 d Total liabilities are determined by subtracting stockholders equity ending balance f...View the full answer


Financial Accounting An Integrated Statements Approach
ISBN: 978-0324312119
2nd Edition
Authors: Jonathan E. Duchac, James M. Reeve, Carl S. Warren
