

Question: Create an Excel spreadsheet that graphs the portfolio return and standard deviation combinations found in Problem 5.12 for Home Depot and Lowe's. Data from Prob.
Create an Excel spreadsheet that graphs the portfolio return and standard deviation combinations found in Problem 5.12 for Home Depot and Lowe's.
Data from Prob. 5.12
Use the table of annual returns in Problem 5.9 for Home Depot (HD) and Lowe’s (LOW) to create an Excel spreadsheet that calculates returns for portfolios that comprise HD and LOW using the following, respective, weightings: (1.0, 0.0), (0.9, 0.1), (0.8, 0.2), (0.7, 0.3), (0.6, 0.4), (0.5, 0.5), (0.4, 0.6), (0.3, 0.7), (0.2, 0.8), (0.1, 0.9), and (0.0, 1.0). Also, calculate the portfolio standard deviation associated with each portfolio composition. You will need to use the standard deviations found previously for HD and LOW and their correlation coefficient.
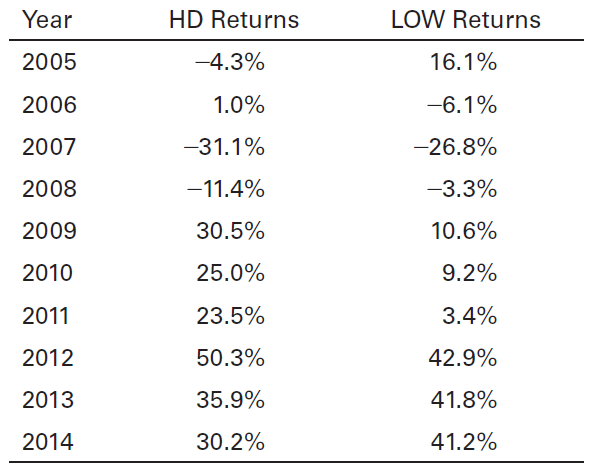
LOW Returns 16.1% Year 2005 2006 2007 2008 2009 2010 2011 2012 2013 2014 -4.3% 1.0% -31.1% -11.4% 30.5% 25.0% 23.5% 50.3% 35.9% 30.2% 26.8% -3.3% 10.6% 9.2% 3.4% 42.9% 41.8% 41.2%
Step by Step Solution
3.33 Rating (180 Votes )
There are 3 Steps involved in it
Return 155 150 145 ... View full answer

Get step-by-step solutions from verified subject matter experts
Document Format (1 attachment)
1136-B-C-F-B-V(1626).docx
120 KBs Word File