

Question: Develop a spreadsheet model for Classify each of the data elements in the Sales Transactions database (Figure 1.1) as categorical, ordinal, interval, or ratio data
Develop a spreadsheet model for Classify each of the data elements in the Sales Transactions database (Figure 1.1) as categorical, ordinal, interval, or ratio data and explain why. Apply the principles of spreadsheet engineering in developing your model. Use the spreadsheet to create a table for a range of prices to help you identify the price that results in the maximum revenue.
Figure 1.1
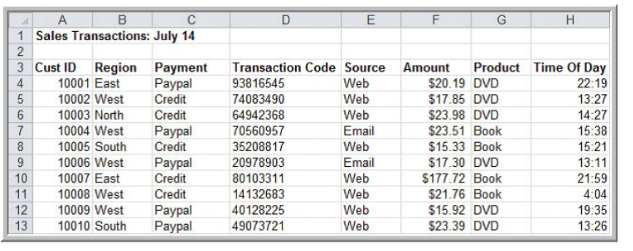
1 Sales Transactions: July 14 3 Cust ID Region Payment ypal Credit Transaction Code Source Amount Product Time Of Day 4 10001 East 93816545 Web $20.19 DVD 22:19 13:27 14:27 5 10002 West 10003 North 10004 West 74083490 Web $17.85 DVD $23.98 DVD $23.51 Book $15.33 Book $17.30 DVD $177.72 Book $21.76 Book $15.92 DVD Credit ypal 64942368 Web Email Web 70560957 15:38 8 10005 South Credit 35208817 15:21 10006 West aypal Credit 20978903 Email 13:11 10 10007 East 80103311 Web 21:59 11 10008 West Credit 14132683 Web 4:04 12 10009 West ypal pal 40128225 Web 19:35 13 10010 South 49073721 Web $23.39 DVD 13:26 67o99
Step by Step Solution
3.57 Rating (171 Votes )
There are 3 Steps involved in it
Price Demand Model D 2500 3P C 5000 5D Intercept Slope Intercept Slope 2500 3 500... View full answer

Get step-by-step solutions from verified subject matter experts
Document Format (1 attachment)
607-B-B-C-B-M (899).xlsx
300 KBs Excel File