

Question: Draw a box-and-whisker plot that represents the data set. Use the data set, which represents the fuel economies (in highway miles per gallon) of several
Draw a box-and-whisker plot that represents the data set.
Use the data set, which represents the fuel economies (in highway miles per gallon) of several Harley-Davidson motorcycles.
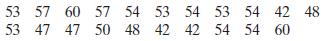
53 57 60 57 54 53 54 53 54 42 48 53 47 47 50 48 42 42 54 54 60
Step by Step Solution
★★★★★
3.31 Rating (172 Votes )
There are 3 Steps involved in it
1 Expert Approved Answer
Step: 1 Unlock

Motorcycle Fuel Economi... View full answer
Question Has Been Solved by an Expert!
Get step-by-step solutions from verified subject matter experts
Step: 2 Unlock
Step: 3 Unlock
Document Format (1 attachment)
598-M-S-P (4475).docx
120 KBs Word File