

Question: Construct a relative frequency histogram for the data set using seven classes. Use the data set shown in the table at the left, which represents
Construct a relative frequency histogram for the data set using seven classes.
Use the data set shown in the table at the left, which represents the actual liquid volumes (in ounces) in 24 twelve-ounce cans.
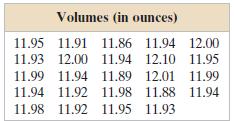
Volumes (in ounces) 11.95 11.91 11.86 1194 12.00 11.93 12.00 11.94 12.10 11.95 11.99 11.94 11.89 12.01 11.99 11.94 11.92 11.98 11.88 11.94 11.98 11.92 11.95 11.93
Step by Step Solution
★★★★★
3.43 Rating (162 Votes )
There are 3 Steps involved in it
1 Expert Approved Answer
Step: 1 Unlock

Class width Max Min Number of classes 1210 1186 7 003 004 Class 11861189 11901193 11... View full answer
Question Has Been Solved by an Expert!
Get step-by-step solutions from verified subject matter experts
Step: 2 Unlock
Step: 3 Unlock
Document Format (1 attachment)
598-M-S-P (4476).docx
120 KBs Word File