

Question: Evaluate each of the following visuals. Is visuals message clear? Is it the right visual for the story? Is the visual designed appropriately? Is color,
Evaluate each of the following visuals.
Is visual’s message clear?
Is it the right visual for the story?
Is the visual designed appropriately? Is color, if any, used appropriately?
Is the visual free from chart junk?
Does the visual distort data or mislead the reader in anyway?
1.
2.
3.
4.
5.
6.

7.
8.
9.
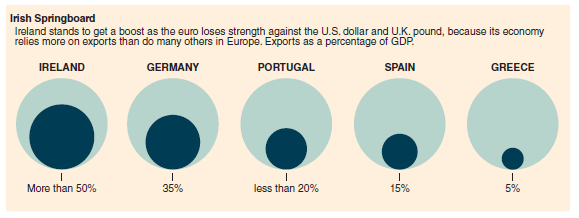
Irish Springboard .pond, beause its economy relies more on exports than do many others in Europe. Exports as a percentage of GDP. IRELAN PORTUGAL SPAIN GREECE More than 50% 35% less than 20% 15% 596
Step by Step Solution
3.48 Rating (161 Votes )
There are 3 Steps involved in it
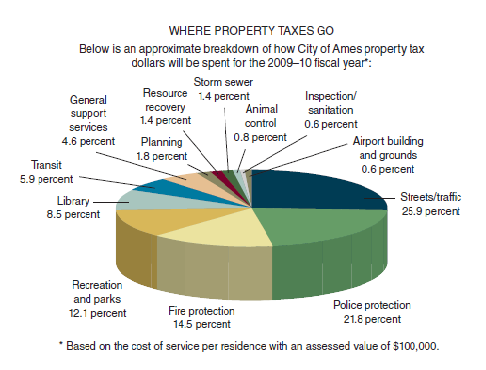
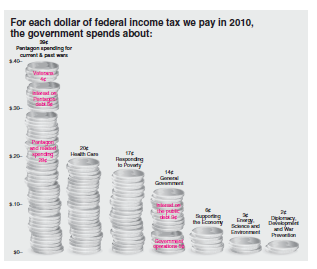
Where Do Property Taxes Go There is too much clutter on the graphic in terms of labels The labels lines are hard to follow and get washed out on top o... View full answer

Get step-by-step solutions from verified subject matter experts
Document Format (1 attachment)
284-B-B-C-C-S (410).docx
120 KBs Word File