

Question: Figure is a graph of v versus t for a particle moving along a straight line. The position of the particle at time t =
Figure is a graph of v versus t for a particle moving along a straight line. The position of the particle at time t = 0 is x0 = 5m.
(a) Find x for various times t by counting squares, and sketch x versus t.
(b) Sketch the acceleration a versus t.
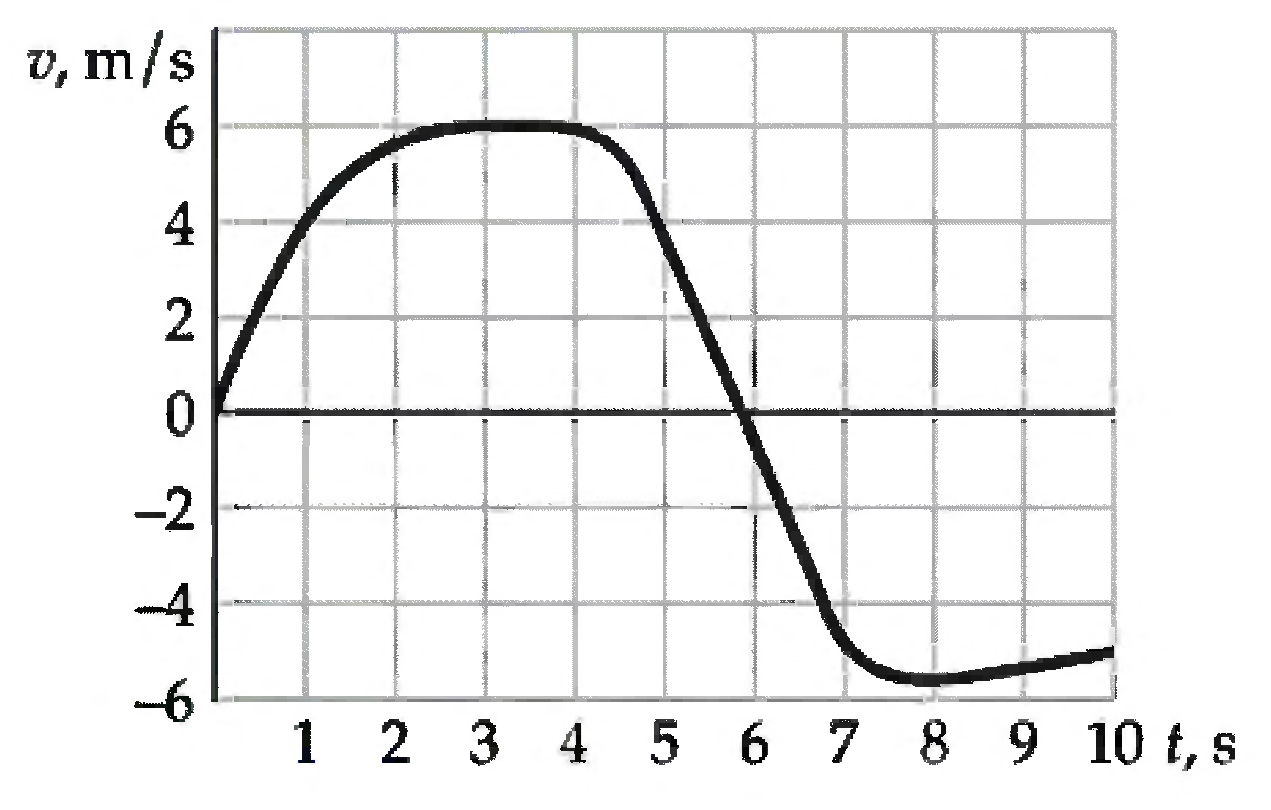
v, m/s 6. 4 -2 -4 -6 1 2 3 4 5 6 7 8 9 10 t, s
Step by Step Solution
★★★★★
3.32 Rating (167 Votes )
There are 3 Steps involved in it
1 Expert Approved Answer
Step: 1 Unlock

a Count squares to t 1 s 2 s 3 s 4 s 5 ... View full answer
Question Has Been Solved by an Expert!
Get step-by-step solutions from verified subject matter experts
Step: 2 Unlock
Step: 3 Unlock
Document Format (1 attachment)
10-P-M-1D (408).docx
120 KBs Word File