

Question: For most services, longer customer waiting times mean lower customer satisfaction. Suppose you have the following data to use for a simple linear regression analysis
For most services, longer customer waiting times mean lower customer satisfaction. Suppose you have the following data to use for a simple linear regression analysis intended to link length of waiting time before speaking to a customer service representative (x) and customer satisfaction (y) for your company’s customer service department. (Customer satisfaction is measured by scoring customer responses in a follow up questionnaire.)
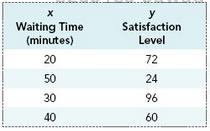
Waiting Time (minutes) 20 Satisfaction Level 72 24 96 60 30 40
Step by Step Solution
3.36 Rating (162 Votes )
There are 3 Steps involved in it
x y xy x 2 20 72 1440 400 50 24 1200 2500 30 96 2880 900 40 60 2400 1... View full answer

Get step-by-step solutions from verified subject matter experts
Document Format (1 attachment)
486-M-S-L-R (3053).docx
120 KBs Word File