

Question: The following ANOVA table was produced in a simple linear regression analysis linking company profits (x) to shareholder dividends (y) for a sample of 2
The following ANOVA table was produced in a simple linear regression analysis linking company profits (x) to shareholder dividends (y) for a sample of 2 β = 0companies. Notice that some of the entries in the table are missing.
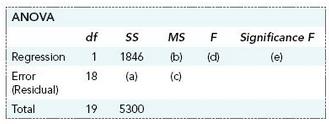
Fill in the missing values. Can we use the sample results represented here to reject a β = 0null hypothesis at the 5% significance level?
ANOVA df SS MS F Significance F Regression 1846 (d) Error Residual) Total 18 (a) (c) 19 5300
Step by Step Solution
3.36 Rating (168 Votes )
There are 3 Steps involved in it
ANOVA df SS MS F Significance F Regression 1 1846 1846 9621 00062 Error Residual 18 ... View full answer

Get step-by-step solutions from verified subject matter experts
Document Format (1 attachment)
486-M-S-L-R (3054).docx
120 KBs Word File