

Question: Here are comparative statement data for Martin Company and Lewis Company, two competitors. All balance sheet data are as of December 31, 2012, and December
Here are comparative statement data for Martin Company and Lewis Company, two competitors. All balance sheet data are as of December 31, 2012, and December 31, 2011.
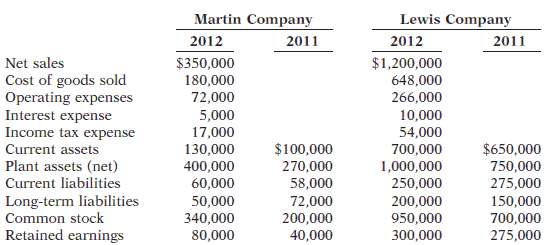
Instructions(a) Prepare a vertical analysis of the 2012 income statement data for Martin Company and Lewis Company.(b) Comment on the relative profitability of the companies by computing the return on assets and the return on common stockholders' equity ratios for both companies.
GG Lewis Company Martin Company 2012 2011 2012 2011 Net sales $1,200,000 648,000 $350,000 180,000 72,000 Cost of goods sold Operating expenses Interest expense Income tax expense Current assets Plant assets (net) 266,000 10,000 5,000 17,000 54,000 $100,000 130,000 700,000 1,000,000 250,000 $650,000 400,000 270,000 750,000 275,000 Current liabilities 60,000 50,000 340,000 80,000 58,000 Long-term liabilities Common stock 200,000 72,000 200,000 150,000 950,000 700,000 Retained earnings 40,000 300,000 275,000
Step by Step Solution
3.43 Rating (162 Votes )
There are 3 Steps involved in it
a Condensed Income Statement For the Year Ended December 31 2012 Martin Company Lewis Company Dollar... View full answer

Get step-by-step solutions from verified subject matter experts
Document Format (1 attachment)
48-B-A-F-A (147).docx
120 KBs Word File