

Question: In Exercises 32, do the following. (a) Find the equation of the regression line for the data, letting Row 1 represent the x-values and Row
In Exercises 32, do the following.
(a) Find the equation of the regression line for the data, letting Row 1 represent the x-values and Row 2 the y-values. Sketch a scatter plot of the data and draw the regression line.
(b) Find the equation of the regression line for the data, letting Row 2 represent the x-values and Row 1 the y-values. Sketch a scatter plot of the data and draw the regression line.
(c) What effect does switching the explanatory and response variables have on the regression line?
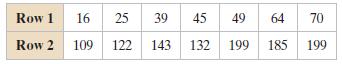
Row 1 16 25 3945 49 64 70 Row 2 109 122 143 132 199 185 199
Step by Step Solution
3.39 Rating (168 Votes )
There are 3 Steps involved in it
a b c The slope of the line ... View full answer

Get step-by-step solutions from verified subject matter experts
Document Format (1 attachment)
598-M-S-L-R (5448).docx
120 KBs Word File