

Question: In Figure is shown the pressure?temperature phase diagram for H 2 O. Apply the Gibbs phase rule at points A, B, and C; that is,
In Figure is shown the pressure?temperature phase diagram for H2O. Apply the Gibbs phase rule at points A, B, and C; that is, specify the number of degrees of freedom at each of the points?that is, the number of externally controllable variables that need be specified to completely define the system.
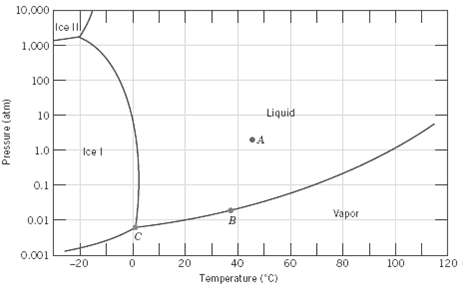
10,000 Ice II 1,000 100 Liquid 10 1.0 Icet 0.1 Vapor 0.01 0.001 -20 20 40 60 80 100 120 Temperature ("C) Pressure (atm)
Step by Step Solution
3.49 Rating (166 Votes )
There are 3 Steps involved in it
We are asked to specify the value of F for Gibbs phase rule at points A B and C on the pressuretempe... View full answer

Get step-by-step solutions from verified subject matter experts
Document Format (1 attachment)
33-E-M-S-E-M-S (351).docx
120 KBs Word File