

Question: In a photoelectric-effect experiment, the maximum kinetic energy of the ejected photoelectrons is measured for various wavelengths of the incident light. Figure 38.35 shows a
In a photoelectric-effect experiment, the maximum kinetic energy of the ejected photoelectrons is measured for various wavelengths of the incident light. Figure 38.35 shows a graph of this maximum kinetic energy, Kmax, as a function of the wavelength ? of the light falling on the surface of the metal. What are?(a) The threshold frequency and(b) The work function (in electron volts) for this metal?(c) Data from experiments like this are often graphed showing K max as a function of I/?, make a qualitative (no numbers) sketch of what this graph would look like. Identify the threshold wavelength (?0) on your sketch. What advantages are there to graphing the data this way?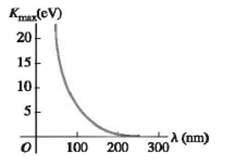
Kmax(CV) 20 15 10 5 100 200 (nm) 300
Step by Step Solution
3.31 Rating (154 Votes )
There are 3 Steps involved in it
IDENTIFY In the photoelectric effect the energy of the photon is used to eject an ... View full answer

Get step-by-step solutions from verified subject matter experts
Document Format (1 attachment)
P-M-P-P-E-A (10).docx
120 KBs Word File