

Question: In the following data pairs, A represents birthrate and B represents death rate per 1000 resident population. The data are paired by counties in the
In the following data pairs, A represents birthrate and B represents death rate per 1000 resident population. The data are paired by counties in the Midwest. A random sample of 16 counties gave the following information (Reference: County and City Data Book, U.S. Department of Commerce).
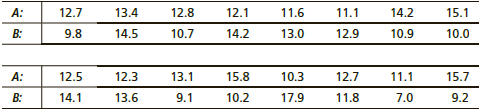
Do the data indicate a difference (either way) between population average birth rate and death rate in this region? Use a = 0.01
(a) What is the level of significance? State the null and alternate hypotheses. Will you use a left-tailed, right-tailed, or two-tailed test?
(b) Check Requirements What sampling distribution will you use? What assumptions are you making? Compute the value of the sample test statistic and corresponding t value.
(c) Find (or estimate) the P-value. Sketch the sampling distribution and show the area corresponding to the P-value.
(d) Based on your answers in parts (a) to (c), will you reject or fail to reject the null hypothesis? Are the data statistically significant at level a?
(e) Interpret your conclusion in the context of the application.
12.1 14.2 12.7 12.8 15.1 2 11.6 11.1 14.2 2 10.7 13.0 12.9 10.9 10.0 12.5 12.3 13.1 15.8 10.3 12.7 11.1 15.7 14.1 9.1 10.2 17.9 11.8 7.0
Step by Step Solution
3.47 Rating (170 Votes )
There are 3 Steps involved in it
a 001 H 0 d 0 H 1 d 0 Since is in H1 a two tailed test is used b Use ... View full answer

Get step-by-step solutions from verified subject matter experts
Document Format (1 attachment)
1275-M-S-P-E(1385).docx
120 KBs Word File