

Question: The following data are based on information taken from the book Navajo Architecture: Forms, History, Distributions by S. C. Jett and V. E. Spencer (University
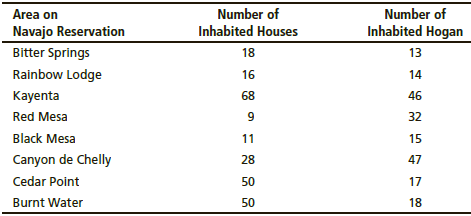
The following data are based on information taken from the book Navajo Architecture: Forms, History, Distributions by S. C. Jett and V. E. Spencer (University of Arizona Press). A survey of houses and traditional hogans was made in a number of different regions of the modern Navajo Indian Reservation. The following table is the result of a random sample of eight regions on the Navajo Reservation.
Does this information indicate that the population mean number of inhabited houses is greater than that of hogans on the Navajo Reservation? Use a 5% level of significance.
(a) What is the level of significance? State the null and alternate hypotheses. Will you use a left-tailed, right-tailed, or two-tailed test?
(b) Check Requirements What sampling distribution will you use? What assumptions are you making? Compute the value of the sample test statistic and corresponding t value.
(c) Find (or estimate) the P-value. Sketch the sampling distribution and show the area corresponding to the P-value.
(d) Based on your answers in parts (a) to (c), will you reject or fail to reject the null hypothesis? Are the data statistically significant at level a?
(e) Interpret your conclusion in the context of the application.
Number of Inhabited Houses 18 16 68 Number of Inhabited Hogan 13 Area on Navajo Reservation Bitter Springs Rainbow Lodge Kayenta Red Mesa Black Mesa Canyon de Chelly Cedar Point Burnt Water 46 32 15 47 17 18 28 50 50
Step by Step Solution
3.36 Rating (168 Votes )
There are 3 Steps involved in it
a 005 H 0 d 0 H 1 d 0 Since is in H1 a right tailed test is used b Us... View full answer

Get step-by-step solutions from verified subject matter experts
Document Format (1 attachment)
1275-M-S-P-E(1386).docx
120 KBs Word File