

Question: In their book Empirical Model Building and Response Surfaces (John Wiley, 1987), G. E. P. Box and N. R. Draper describe an experiment with three
In their book Empirical Model Building and Response Surfaces (John Wiley, 1987), G. E. P. Box and N. R. Draper describe an experiment with three factors. The data shown in Table 8E.7 are a variation of the original experiment on p. 247 of their book. Suppose that these data were collected in a semiconductor manufacturing process.
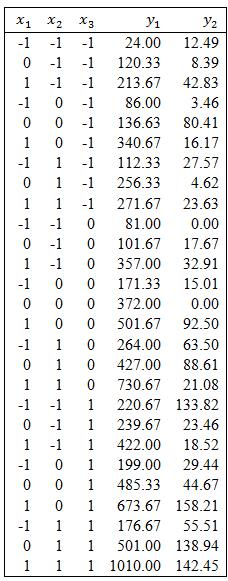
a. The response ![]() is the average of three readings on resistivity for a single wafer. Fit a quadratic model to this response.
is the average of three readings on resistivity for a single wafer. Fit a quadratic model to this response.
b. The response ![]() is the standard deviation of the three resistivity measurements. Fit a first-order model to this response.
is the standard deviation of the three resistivity measurements. Fit a first-order model to this response.
c. Where would you recommend that we set  if the objective is to hold mean resistivity at 500 and minimize the standard deviation?
124.00 12.49 0 120.33 8.39 1 213.67 42.83 1 0 86.003.46 0 0 136.63 80.41 1 0340.67 16.17 1 112.33 27.57 0 256.33 4.62 1 271.67 23.63 081.00 0.00 0 1 0 101.67 17.67 1 1 0 357.00 32.91 -1 0 0 171.33 15.01 0 0 0 372.00 0.00 1 0 0 501.67 92.50 264.00 63.50 0 1 0 427.00 88.61 1 1 0 730.67 21.08 220.67 133.82 0 1 239.67 23.46 1 1 422.00 18.52 -1 0 1 199.00 29.44 0 0 485.33 44.67 1 0 673.67 158.21 1 176.67 55.51 0 501.00 138.94 1 1 1 1010.00 142.45 9 3 2
Step by Step Solution
3.47 Rating (173 Votes )
There are 3 Steps involved in it
a Enter the data into the worksheet Then define the design as a response surface design by going to ... View full answer

Get step-by-step solutions from verified subject matter experts
Document Format (1 attachment)
552-M-S-Q-C-B-S (430).docx
120 KBs Word File