

Question: Is electromagnetic radiation from phone antennae associated with declining bird populations? This is one of the questions addressed by the authors of the paper The
Is electromagnetic radiation from phone antennae associated with declining bird populations? This is one of the questions addressed by the authors of the paper “The Urban Decline of the House Sparrow (Passer domesticus): A Possible Link with Electromagnetic Radiation” (Electromagnetic Biology and Medicine [2007]: 141–151). The accompanying data on x = electromagnetic field strength (V/m) and y = sparrow density (birds/hectare) was read from a graph that appeared in the paper.
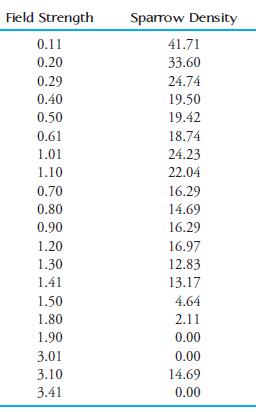
a. Construct a scatterplot of y = sparrow density versus x = field strength. Does the relationship between these two variables appear to be linear or nonlinear?
b. Consider transforming the data by leaving y unchanged and using either 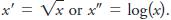 The log(x) values given in the same order as the x values in the table above are
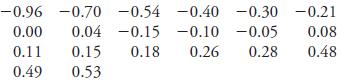
Which of these transformations would you recommend? Justify your choice using appropriate graphical displays.
c. Using the transformation you recommend in Part (b), find the equation of the least-squares line that describes the relationship between y and the transformed x. y^ = 14.805 - 24.280 # log1x2
d. What would you predict for sparrow density if the field strength is 0.5? What would you predict for sparrow density if the field strength is 2.5?
10,4 0 2 4 3 4 9 9 9 7 3 7 4 1 0 0 90 767547202629, 8 I 610060 11 3 4 9 9 8 4 2 6 4 6 6 2 3 4 2 0 0 4 0 10900110000001000101 2 2 4 5 6 0 1 7 8 9 2 3 4 5 8 9 0 14 xVx oxlogx). -0.96-0.70 -0.54-0.400.30-0.21 0.00 0.040.150.100.05 0.08 0.11 0.15 0.18 0.26 0.28 0.48 0.49 0.53
Step by Step Solution
3.43 Rating (178 Votes )
There are 3 Steps involved in it
a The relationship between sparrow density and field strength appears ... View full answer

Get step-by-step solutions from verified subject matter experts
Document Format (1 attachment)
536-M-S-D-A (4228).docx
120 KBs Word File