

Question: Kinder Company has these comparative balance sheet data: Additional information for 2014: 1. Net income was $25,000. 2. Sales on account were $375,000. Sales returns
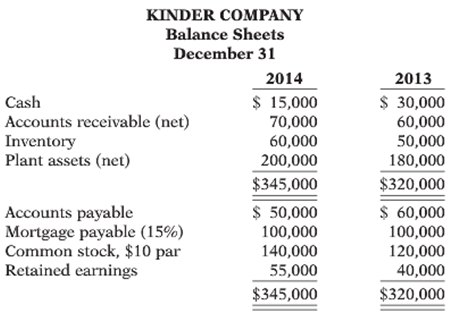
Kinder Company has these comparative balance sheet data:
Additional information for 2014:
1. Net income was $25,000.
2. Sales on account were $375,000. Sales returns and allowances amounted to $25,000.
3. Cost of goods sold was $198,000.
4. Net cash provided by operating activities was $48,000.
5. Capital expenditures were $25,000, and cash dividends were $10,000.
Instructions
Compute the following ratios at December 31, 2014.
(a) Current ratio.
(b) Accounts receivable turnover.
(c) Average collection period.
(d) Inventory turnover.
(e) Days in inventory.
(f) Cash debt coverage.
(g) Current cash debt coverage.
(h) Free cash flow.
KINDER COMPANY Balance Sheets December 31 2013 2014 $ 15,000 70,000 60,000 $ 30,000 60,000 50,000 180,000 Cash Accounts receivable (net) Inventory Plant assets (net) 200,000 $345,000 $ 50,000 100,000 140,000 $320,000 Accounts payable Mortgage payable (15%) Common stock, $10 par Retained earnings $ 60,000 100,000 120,000 40,000 55,000 $345,000 $320,000
Step by Step Solution
3.39 Rating (152 Votes )
There are 3 Steps involved in it
a Current ratio 2901 b Accounts receivable turnover 54 times 1 c Aver... View full answer

Get step-by-step solutions from verified subject matter experts
Document Format (1 attachment)
291-B-M-A-F-S-A (1728).docx
120 KBs Word File