

Question: Hendi Company has these comparative balance sheet data: Additional information for 2012:1. Net income was $25,000.2. Sales on account were $375,000. Sales returns and allowances
Hendi Company has these comparative balance sheet data:
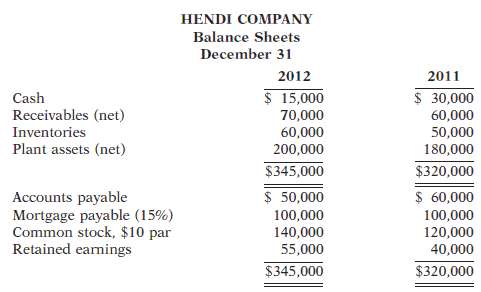
Additional information for 2012:1. Net income was $25,000.2. Sales on account were $375,000. Sales returns and allowances amounted to $25,000.3. Cost of goods sold was $198,000.4. Net cash provided by operating activities was $48,000.5. Capital expenditures were $25,000, and cash dividends were $10,000.InstructionsCompute the following ratios at December 31, 2012.(a) Current.(b) Receivables turnover.(c) Average collection period.(d) Inventory turnover.(e) Days in inventory.(f ) Cash debt coverage.(g) Current cash debt coverage.(h) Free cash flow.
HENDI COMPANY Balance Sheets December 31 2012 2011 $ 15,000 70,000 $ 30,000 Cash Receivables (net) 60,000 Inventories 60,000 50,000 Plant assets (net) 200,000 180,000 $345,000 $320,000 $ 50,000 $ 60,000 Accounts payable Mortgage payable (15%) Common stock, $10 par Retained earnings 100,000 100,000 120,000 140,000 55,000 40,000 $345,000 $320,000
Step by Step Solution
3.28 Rating (163 Votes )
There are 3 Steps involved in it
a b c Average collection period 365 days ... View full answer

Get step-by-step solutions from verified subject matter experts
Document Format (1 attachment)
48-B-A-F-A (138).docx
120 KBs Word File