

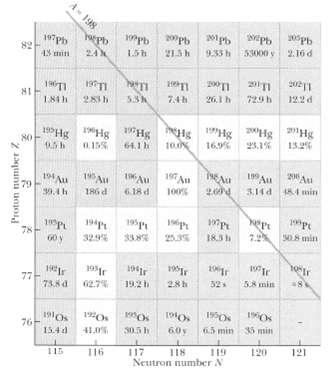
Question: Make a nuclides chart similar to Figure for the 2.5 nuclides 118-122 Te, 117-121 Sb, 116-120 Sn, 115-119 I n, and 114-118Cd. Draw in and
Make a nuclides chart similar to Figure for the 2.5 nuclides 118-122 Te, 117-121 Sb, 116-120 Sn, 115-119 I n, and 114-118Cd. Draw in and label
(a) All isobaric (constant A) lines and
(b) All lines of constant neutron excess, defined as N -Z.
A- 198 epb 82 43 min 2.16 d 24X 213h 9.33 h 53000 y 19 200n 20n 5.3A 7.4h 1.84h 26,1 h 729 h 122d SHost 0.155 SHost 64.1 Hg Hg 19"Hg Hg 80 100 16.9% 13.2% 23.1% 104 Au Au 186 d 79 6.18d 100% 3.14d 84 min 19P 78 19P 19P 7.% 338% 329% 25.3% 18.3 h 508 min 19 77 73.8 d 62.7% 19.2h 32 28h 5.8 min 19Os 19Os 76 19Os 15.4d 41.0% 35 min S0.5 h 60y 6.5 min 115 116 117 118 Neutron number N 119 120 121 Proton number Z
Step by Step Solution
3.38 Rating (167 Votes )
There are 3 Steps involved in it
Although we havent drawn the requested lines in the following table we can indicate their slop... View full answer

Get step-by-step solutions from verified subject matter experts
Document Format (1 attachment)
2-P-M-P-N-P (272).docx
120 KBs Word File