

Question: Make a plot of bonding energy versus melting temperature for the metals listed in Table 2.3. Using this plot, approximate the bonding energy for copper
Make a plot of bonding energy versus melting temperature for the metals listed in Table 2.3. Using this plot, approximate the bonding energy for copper which has a melting temperature of 1084?C.
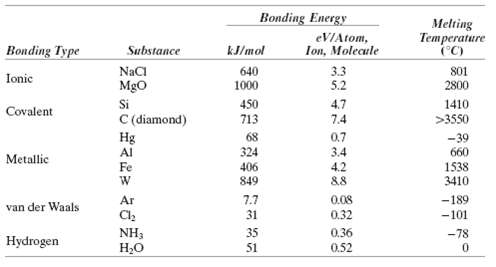
Bonding Energy Melting eVIAtom, Ion, Molecule Temperature (C) Bonding Type Substance kJ/mol NaCI Mgo Si C (diamond) Hg Al 640 3.3 5.2 801 Ionic 2800 1000 4.7 7.4 450 713 1410 Covalent >3550 68 0.7 -39 660 324 3.4 4.2 &8 Metallic Fe 406 1538 3410 849 Ar 7.7 31 0.08 -189 -101 van der Waals 0.32 NH3 H,O 35 0.36 -78 Hydrogen 51 0.52
Step by Step Solution
3.39 Rating (158 Votes )
There are 3 Steps involved in it
Graph below represents the melting temperature and bonding energy ... View full answer

Get step-by-step solutions from verified subject matter experts
Document Format (1 attachment)
33-E-M-S-E-M-S (20).docx
120 KBs Word File