

Question: McDonalds would like to compare the wait times its drive through customers experience vs. the wait times its customers using the restaurants inside counters experience.
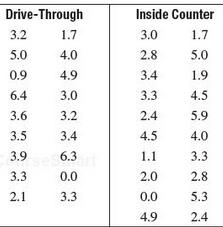
McDonald’s would like to compare the wait times its drive through customers experience vs. the wait times its customers using the restaurants’ inside counters experience. The following data represent the wait times, in minutes, randomly selected customers in the two types of groups experienced. These data can also be found in the Excel file wait times.xlsx. Assume the population variances for the wait times for both locations are equal.
a. Using α = 0.05, perform a hypothesis test to determine if the average wait time differs for customers in these two locations.
b. Approximate the p value using Table 5 in Appendix A and interpret the result.
c. Construct a 95% confidence interval to estimate the average difference in wait time between these locations. Interpret your result.
d. Verify your results using PHStat or Excel.
e. Identify the p value using Excel and interpret the result.
f. What assumptions need to be made in order to perform this procedure?
Drive-Through 3.2 .7 5.0 4.0 0.9 4.9 6.4 3.0 3.6 3.2 3.5 3.4 3.9 6.3 3.3 0.0 2. 3.3 Inside Counter 3.0 1.7 2.8 5.0 3.4 1.9 3.3 4.5 2.4 5.9 4.5 4.0 3.3 2.0 2.8 0.0 5.3 4.9 2.4
Step by Step Solution
3.30 Rating (171 Votes )
There are 3 Steps involved in it
a There is not enough evidence to conclude that the average wait time is ... View full answer

Get step-by-step solutions from verified subject matter experts
Document Format (1 attachment)
483-M-S-H-T (1518).docx
120 KBs Word File