

Perlman-Douglas, a major retailing and mail-order operation, has been in business for the past 10 years. During
Question:
Perlman-Douglas, a major retailing and mail-order operation, has been in business for the past 10 years. During that time, the mail-order operations have grown from a sideline to more than 80 percent of the company’s annual sales. Of course, the company has suffered growing pains. There were times when overloaded or faulty computer programs resulted in lost sales. And, hiring and scheduling temporary employees to augment the permanent staff during peak periods has always been a problem.
Gail Lobanoff, manager of mail-order operations, has developed procedures for handling most problems. However, she is still trying to improve the scheduling of temporary employees to take telephone orders from customers. Under the current system, Lobanoff keeps a permanent staff of 60 employees who handle the basic workload. Based on her estimate of the upcoming week’s telephone volume, she determines the number of temporary employees needed. The permanent employees are paid an average of $10 per hour plus 30 percent fringe benefits. The temporary employees are paid $7 per hour with no fringe benefits. The full-time employees are seldom sent home when volume is light and they are not paid for hours missed. Temporary employees are paid only for the hours worked. Perlman-Douglas normally has three supervisors who earn $1,000 per month, but one additional supervisor is hired when temporary employees are used.
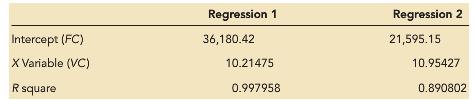
Lobanoff has decided to try regression analysis as a way to improve the prediction of total costs of processing telephone orders. By summarizing the daily labor hours into monthly totals for the past year, she was able to determine the number of labor hours incurred each month. In addition, she summarized the number of orders that had been processed each month. After entering the data into a spreadsheet, Lobanoff ran two regressions. Regression 1 related the total hours worked (permanent and temporary employees) to the total cost of operating the phone center. Regression 2 related the number of orders taken to the total cost.
The data used and regression output is as follows:
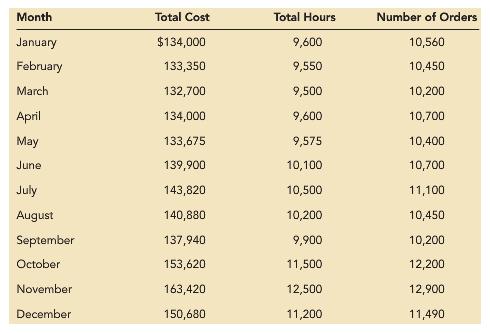
Regression equation: TC = FC + VC (hours), or TC = FC + VC (orders), where TC = total cost, FC = fixed cost, and VC = variable cost per hour or order.
Required
A. What is the total cost formula for each of the above regressions? State each formula using costs that are rounded to the nearest cent.
B. Gail Lobanoff estimates that 12,470 orders will be received and 12,000 hours will be worked during January. Use each cost formula you developed in question A to predict the total cost of operating the phone center. Round your answers to the nearest dollar.
C. Gail needs to select one of the models for use in predicting total phone center costs for next year’s monthly budget.
(1) What are the objectives in selecting a prediction model?
(2) What options are available to Gail? That is, what other independent variables might be used to predict the costs of the phone center?
Step by Step Answer:
A The total cost equation using hours as the independent variable is 361804...View the full answer


Managerial Accounting A Focus on Ethical Decision Making
ISBN: 978-0324663853
5th edition
Authors: Steve Jackson, Roby Sawyers, Greg Jenkins
