

Question: Plot the data and show the least squares line and the corresponding estimated regression equation. Given the line youve drawn, about how much does the
Plot the data and show the least squares line and the corresponding estimated regression equation. Given the line you’ve drawn, about how much does the number of late or missed payments appear to fall as credit score increases by 100 points?
Trenton Bank has a scoring system that it uses to evaluate new loan applications. You’ve been tracking the number of late or missed payments for a sample of “high risk” customers who received loans and have had scheduled payments over the past 60 months. The table below shows the number of late or missed payments and the credit scores for the four customers in the study.
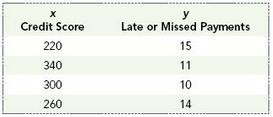
Late or Missed Payments 15 Credit Score 220 340 300 260 10 14
Step by Step Solution
3.31 Rating (172 Votes )
There are 3 Steps involved in it
x y xy x 2 220 15 3300 48400 340 11 3740 115600 300 10 3000 90000 2... View full answer

Get step-by-step solutions from verified subject matter experts
Document Format (1 attachment)
486-M-S-L-R (3033).docx
120 KBs Word File