

Question: Plot the vapour pressure data for a mixture of benzene (B) and acetic acid (A) given below and plot the vapour pressure/composition curve for the
Plot the vapour pressure data for a mixture of benzene (B) and acetic acid (A) given below and plot the vapour pressure/composition curve for the mixture at 50°e. Then confirm that Raoult's and Henry's laws are obeyed in the appropriate regions. Deduce the activities and activity coefficients of the components on the Raoult's law basis and then, taking B as the solute,
its activity and activity coefficient on a Henry's law basis. Finally,
evaluate the excess Gibbs energy of the mixture over the composition range spanned by the data.
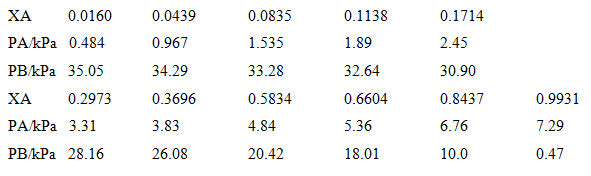
0.0160 0.0439 0.0835 0.1714 XA 0.1138 2.45 PAKPA 0.484 1.535 1.89 0.967 34.29 33.28 PB/kPa 35.05 32.64 0.6604 30.90 0.8437 0.2973 0.3696 0.5834 XA 0.9931 PAKPA 3.31 5.36 7.29 3.83 4.84 6.76 PB/kPa 28.16 26.08 20.42 18.01 0.47 10.0
Step by Step Solution
3.44 Rating (163 Votes )
There are 3 Steps involved in it
The data are plotted in Figure 53 The regions where the vapor pressure curves show approximate strai... View full answer

Get step-by-step solutions from verified subject matter experts
Document Format (1 attachment)
57-C-PC-E (151).docx
120 KBs Word File