

Question: Prepare a spreadsheet to reproduce the lower curve in Figure 10-4. First buffer Second buffer Excess H* region region 12 A 11 F pkz 10
Prepare a spreadsheet to reproduce the lower curve in Figure 10-4.
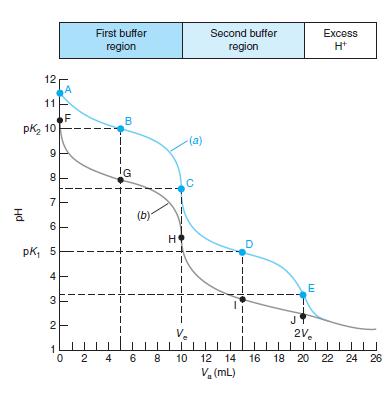
First buffer Second buffer Excess H* region region 12 A 11 F pkz 10 B (a) 9 IG C 7 (b) 6 H pk, 5 E 3 JY 2 V. 2V. 1 O 2 4 6 8 10 12 14 16 18 20 22 24 26 V, (mL) 4. Hd
Step by Step Solution
★★★★★
3.39 Rating (158 Votes )
There are 3 Steps involved in it
1 Expert Approved Answer
Step: 1 Unlock

A B 1 Titrating nicotine with strong acid 2345670 3 Cb 5 Ca 7 Vb 8 9 Kw PH H ... View full answer
Question Has Been Solved by an Expert!
Get step-by-step solutions from verified subject matter experts
Step: 2 Unlock
Step: 3 Unlock
Document Format (1 attachment)
878-E-C-E-E-C (1932).docx
120 KBs Word File