

Question: Random samples of size 64 are drawn from the population in Example 2. Find the mean and standard deviation of the sampling distribution of sample
Random samples of size 64 are drawn from the population in Example 2. Find the mean and standard deviation of the sampling distribution of sample means. Then sketch a graph of the sampling distribution and compare it with the sampling distribution in Example 2.
a. Find μx̅ and σx̅.
b. If n ≥ 30, sketch a normal curve with mean μx̅ and standard deviation σx̅.
c. Compare the results with those in Example 2.
Example 2
Cell phone bills for residents of a city have a mean of $47 and a standard deviation of $9, as shown in the figure. Random samples of 100 cell phone bills are drawn from this population, and the mean of each sample is determined. Find the mean and standard deviation of the sampling distribution of sample means. Then sketch a graph of the sampling distribution.
Distribution for All Cell Phone Bills
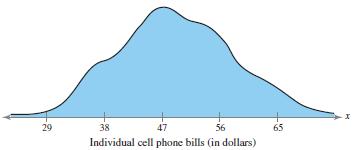
29 38 47 56 65 Individual cell phone bills (in dollars)
Step by Step Solution
3.51 Rating (161 Votes )
There are 3 Steps involved in it
a b c With a smaller s... View full answer

Get step-by-step solutions from verified subject matter experts
Document Format (1 attachment)
598-M-S-P (4889).docx
120 KBs Word File