

Question: Refer to exercise 13 (Home Runs). a. Draw the box plot and use the 1.5 x inter-quartile range approach to identify any outliers. b. Use
Refer to exercise 13 (Home Runs).
a. Draw the box plot and use the “1.5 x inter-quartile range” approach to identify any outliers.
b. Use the “3-standard-deviation” approach to identify any outliers. (The mean is 46.125; the standard deviation is 9.51.)
c. Calculate the z -score for Dale Murphy’s home run total in 1984 (36).
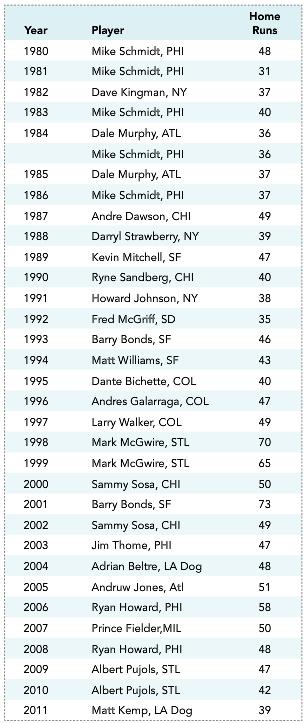
Home Runs Year 1980 1981 1982 1983 1984 Player Mike Schmidt, PHI Mike Schmidt, PHI Dave Kingman, NY Mike Schmidt, PHI Dale Murphy, ATL Mike Schmidt, PHI 48 1985 Dale Murphy, ATL 1986 1987 1988 Dayl Strawberry, NY 1989 Mike Schmidt, PHI Andre Dawson, CHI Kevin Mitchell, SF 1990 Ryne Sandberg. CH Howard Johnson, NY Fred McGriff, SD 1991 1992 1993 Barry Bonds, SF 1994 1995 1996 Anr Galarraga, COL 47 1997 1998 1999 2000 Sammy Sosa, CHI 2001 2002Sammy Sosa, CHI Matt Williams, SF Dante Bichette, COL Larry Walker, COL Mark McGwire, STL Mark MeGwire, STL 70 Barry Bonds, SF Jim Thome, PHI Adrian Beltre, LA Dog Andruw Jones, Atl Ryan Howard, PHI Prince Fielder,MIL Ryan Howard, PHI Albert Pujols, STL Albert Pujols, STL Matt Kemp, LA Dog 2004 2006 2008 2009 2010 47
Step by Step Solution
3.51 Rating (161 Votes )
There are 3 Steps involved in it
a The ordered list is 31 35 36 36 37 37 37 38 39 39 40 40 40 42 43 46 47 47 47 47 ... View full answer

Get step-by-step solutions from verified subject matter experts
Document Format (1 attachment)
486-M-S-S-I (1183).docx
120 KBs Word File