

Question: The table shows the smallest to largest winning payout (per $1 wagered) for winners of the Kentucky Derby, 19702011 a. Draw the box plot for
The table shows the smallest to largest winning payout (per $1 wagered) for winners of the Kentucky Derby, 1970–2011
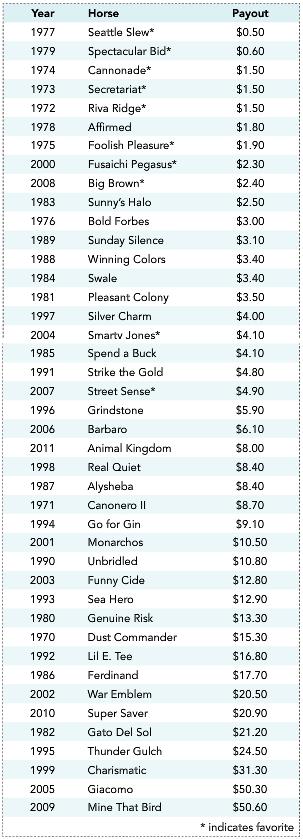
a. Draw the box plot for the payout data. Use the “1.5 x inter-quartile range” approach to identify any outliers.
b. Use the “3-standard-deviation” approach to identify any outliers. (The mean payout is $10.45; the standard deviation is $11.52.)
c. Calculate the z-score for the value $16.80.
Year Horse 1977 Seattle Slew* 1979 Spectacular Bid* Payout $0.50 Cannonade* $1.50 $1.50 $1.50 1973 Secretariat* 1972 Riva Ridge 1978 Affimed 1975 Foolish Pleasure* 2000 Fusaichi Pegasus $2.30 Big Brown $2.50 1976 Bold Forbes 1989 Sunday Silence 1988 Winning Colors 1984 Swale $3.40 Pleasant Colony Silver Char Smartv Jones* 1997 2004 $4.10 1991 Strike the Gold 2007 Street Sense S4.90 Grindstone 2006 Barbaro 2011 Animal Kingdom 1998 Real Quiet 1987 Alysheba $6.10 S8.40 $8.70 $9.10 Monarchos 1990 Unbridled 2003 Funny Cide 1993 Sea Herc 1980 Genuine Risk 1970 Dust Commander 1992 Lil E. Tee $12.80 2010 Super Saver 1982 Gato Del Sol 1995 Thunder Gulch 1999 Charismatic 2005 Giacomo 2009 Mine That Bird $21.20 $24.50 * indicates favorite
Step by Step Solution
3.36 Rating (162 Votes )
There are 3 Steps involved in it
a First Quartile position 42 105 Round up to 11 Q1 is the 11 th value in the orde... View full answer

Get step-by-step solutions from verified subject matter experts
Document Format (1 attachment)
486-M-S-S-I (1182).docx
120 KBs Word File