

Question: Replot the data points of Figure (b) on log-log paper and find an equation approximating the best correlation line. Compare your results with Figure. Then,
Replot the data points of Figure (b) on log-log paper and find an equation approximating the best correlation line. Compare your results with Figure. Then, suppose steam at 1 atm and 100?C is flowing across a 5 cm-OD pipe at a velocity of 1 m/s. Using the data in Figure, estimate the Nusselt number, the heat transfer coefficient, and the rate of heat transfer per meter length of pipe if the pipe is at 200?C and compare with predictions from your correlation equation.GIVENFigure (b) in textSteam flowing across a pipeSteam pressure = 1 atmSteam temperature (Ts) = 100?CPipe outside diameter (D) = 5 cm = 0.05 mSteam velocity (U??) = 1 m/sPipe temperature (Tp) = 200?CASSUMPTIONSSteady stateRadiative heat transfer isnegligible
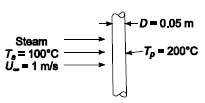
+D-0.05 m Steam T= 100C U.-1 m/s -T,- 200C
Step by Step Solution
3.45 Rating (152 Votes )
There are 3 Steps involved in it
a The data taken from Figure b is shown below and plotted on a loglog scale Fitting this data with a ... View full answer

Get step-by-step solutions from verified subject matter experts
Document Format (1 attachment)
66-E-M-E-H-M-T (1622).docx
120 KBs Word File