

Question: Salary data from two random samples of high school teachers from Pennsylvania and Ohio are as follows. Also shown are the population standard deviations for
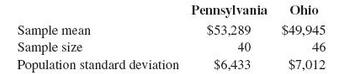
Salary data from two random samples of high school teachers from Pennsylvania and Ohio are as follows. Also shown are the population standard deviations for these populations.
a. Construct a 90% confidence interval to estimate the difference in the average salaries of the high school teachers in these two states.
b. Based on the results from part a, can you conclude that a difference exists in the average salaries?
Pennsylvania Ohio Sample mean Sample size Population standard deviatin $6433 $53.289 $49,945 46 $7,012 40
Step by Step Solution
3.42 Rating (152 Votes )
There are 3 Steps involved in it
a b The confidence interval does not include zero so the... View full answer

Get step-by-step solutions from verified subject matter experts
Document Format (1 attachment)
483-M-S-H-T (1477).docx
120 KBs Word File