

Question: Examine the Minitab output shown here for a multiple regression analysis. How many predictors were there in this model? Comment on the overall significance of
Examine the Minitab output shown here for a multiple regression analysis. How many predictors were there in this model? Comment on the overall significance of the regression model. Discuss the t ratios of the variables and their significance.
The regression equation is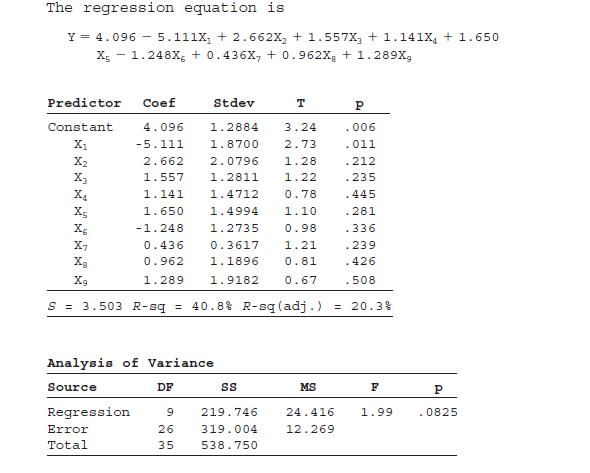
The regression equation is Y 4.096 5.111X +2.662X2 +1.557X + 1.141X + 1.650 X5 -1.248x6 +0.436X7 +0.962XB + 1.289X, Predictor Coef Stdev T P Constant 4.096 1.2884 3.24 .006 X1 -5.111 1.8700 2.73 .011 X2 2.662 2.0796 1.28 .212 X3 1.557 1.2811 1.22 .235 X4 1.141 1.4712 0.78 445 1.650 1.4994 1.10 281 X6 -1.248 1.2735 0.98 .336 X7 0.436 0.3617 1.21 .239 XB 0.962 1.1896 0.81 .426 X9 1.289 1.9182 0.67 .508 S = 3.503 R-sq = 40.8% R-sq (adj.) = 20.3% Analysis of Variance Source DF SS MS F P Regression 9 219.746 Error 26 Total 35 65 319.004 24.416 12.269 1.99 .0825 538.750
Step by Step Solution
There are 3 Steps involved in it

Get step-by-step solutions from verified subject matter experts