

Question: Given here is Excel output for a multiple regression model that was developed to predict y from two independent variables, x1 and x2. Variable x2
Given here is Excel output for a multiple regression model that was developed to predict y from two independent variables, x1 and x2. Variable x2 is a dummy variable.
Discuss the strength of the multiple regression model on the basis of the output.
Focus on the contribution of the dummy variable. Plot x1 and y with x2 as 0, and then plot x1 and y with x2 as 1. Compare the two lines and discuss the differences.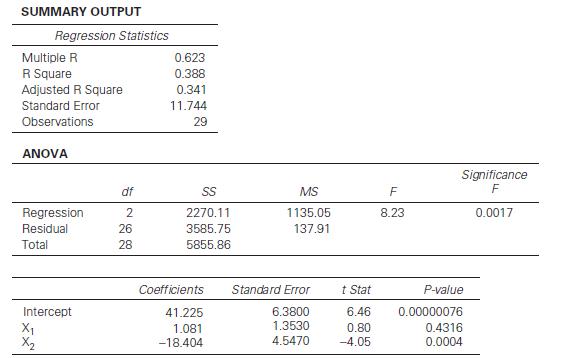
SUMMARY OUTPUT Regression Statistics Multiple R 0.623 R Square 0.388 Adjusted R Square 0.341 Standard Error 11.744 Observations 29 ANOVA Significance F df SS MS F Regression 2 2270.11 1135.05 8.23 0.0017 Residual 26 3585.75 137.91 Total 28 5855.86 Intercept X2 Coefficients Standard Error t Stat P-value 41.225 6.3800 6.46 0.00000076 1.081 1.3530 0.80 0.4316 -18.404 4.5470 -4.05 0.0004
Step by Step Solution
There are 3 Steps involved in it

Get step-by-step solutions from verified subject matter experts