

In Example 13.4.3, change the range of the variables x1 and x2 to x1 > data (hardness)
Question:
In Example 13.4.3, change the range of the variables x1 and x2 to x1 <- rep(seq(-10,10,0.5),100) and x2 <- rep(seq(-10,10, 0.5),each=100) and redo the three-dimensional plot, especially for the third linear regression model. Similarly, for the contour plot of the same model, change the variable ranges to x1=x2=seq(from=-5,to=5, by=0.2) and redraw the contour plot. What are your typical observations?
Data from in Example 13.4.3
Four types of tip are used which form the blocks in this experiment. The variable of interest is the hardness which further depends on the type of metal coupon. For each type of tip, the hardness is observed for four different types of metal coupon. In the next R segment, an ANOVA is first obtained to check if the tip type and coupon type effect the hardness of the coupon. The assumption of normality for the model error is validated through the “Q-Q” plot. Diagnostic measures, leverage points, etc., are obtained using the functions as seen earlier for the linear regression model and the CRD model, Sections 12.5 and 13.3.
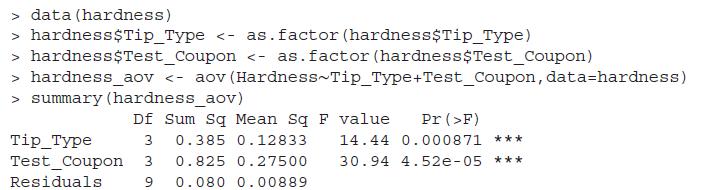
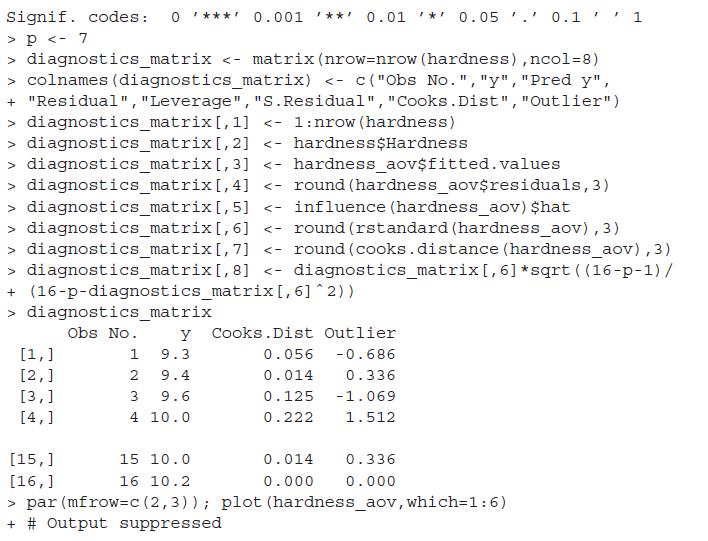
The R lm complementary functions influence, rstandard, and cooks. distance have again been used for the diagnostics of the fitted hardness_aov object. The “Q-Q” plot, see Figure 13.4, shows that the normality assumption is appropriate for the current dataset. Since the Cooks distance does not exceed 1 for any of the observations, we do not have any influential observation.
Step by Step Answer:
In the original example 1343 the ran...View the full answer


A Course In Statistics With R
ISBN: 9781119152729
1st Edition
Authors: Prabhanjan N. Tattar, Suresh Ramaiah, B. G. Manjunath
