

Question: Reconstruct Part A of Figure 6.9 using the curve function instead of the plot function. What are the apparent advantages of using the curve function,
Reconstruct Part A of Figure 6.9 using the curve function instead of the plot function. What are the apparent advantages of using the curve function, if any?
Data from in Figure 6.9
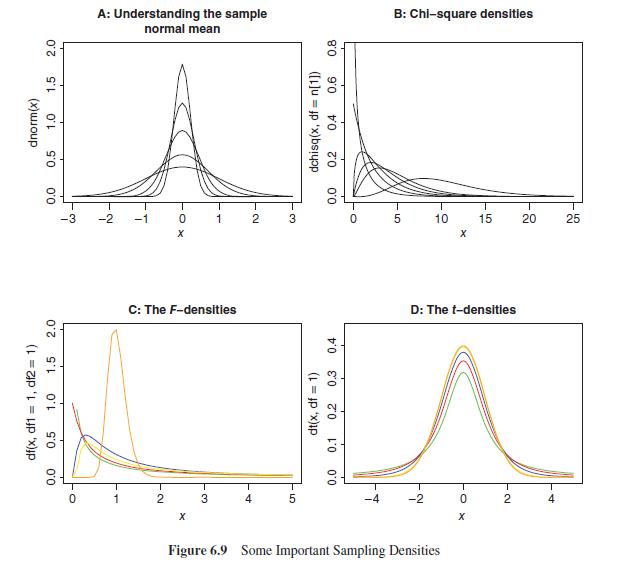
2.0 1.5 dnorm(x) 1.0 0.5 0.0 2.0 1.5 df(x, df1= 1, df2= 1) 1.0 0.5 0.0 -3 0 A: Understanding the sample normal mean FN 1 0 2 C: The F-densities X 1 3 - N 2 4 3 5 0.8 0.6 dchisq(x, df n[1]) 0.4 0.2 0.0 0.4 0.3 dt(x, df = 1) 0.2 0.1 0.0 B: Chi-square densities 0 5 10 T -2 X D: The t-densities Figure 6.9 Some Important Sampling Densities -Ox 15 0 2 20 4 25
Step by Step Solution
3.35 Rating (173 Votes )
There are 3 Steps involved in it
To reconstruct Par... View full answer

Get step-by-step solutions from verified subject matter experts