

Question: Using the R function pareto.chart from the qcc package, obtain the Pareto chart for the causes and frequencies, as in Example 4.10, and compare the
Using the R function pareto.chart from the qcc package, obtain the Pareto chart for the causes and frequencies, as in Example 4.10, and compare the results with Figure 4.9.
Data from in Figure 4.9
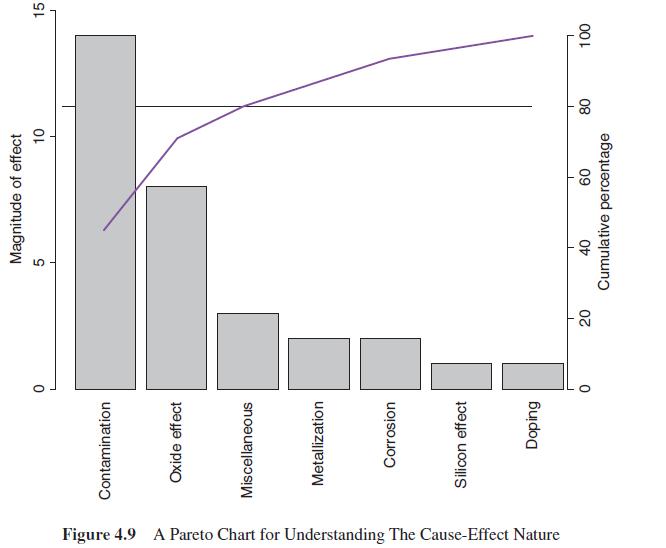
Figure 4.9 A Pareto Chart for Understanding The Cause-Effect Nature Contamination Oxide effect Miscellaneous Metallization Corrosion Silicon effect Doping 0 20 Magnitude of effect 10 5 1 60 1 40 Cumulative percentage T 80 100 15
Step by Step Solution
3.34 Rating (157 Votes )
There are 3 Steps involved in it
Answer To obtain the Pareto chart for the causes and frequencies as in Exampl... View full answer

Get step-by-step solutions from verified subject matter experts