

Continuation of Example 4, Section 1.2: Find the equilibrium value of the digoxin model. What is the
Question:
Continuation of Example 4, Section 1.2: Find the equilibrium value of the digoxin model. What is the significance of the equilibrium value?
Data from example 4
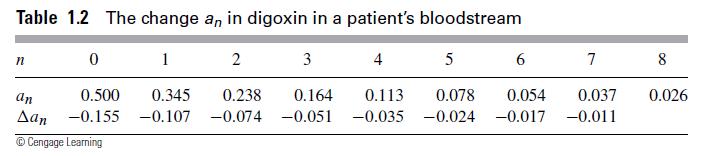
Digoxin is used in the treatment of heart disease. Doctors must prescribe an amount of medicine that keeps the concentration of digoxin in the bloodstream above an effective level without exceeding a safe level (there is variation among patients). For an initial dosage of 0.5 mg in the bloodstream, Table 1.2 shows the amount of digoxin a remaining in the bloodstream of a particular patient after n days, together with the change Δan each day.
Table 1.2
A scatterplot ofΔan versus an from Table 1.2 is shown in Figure 1.11. The graph shows that the change Δan during a time interval is approximately proportional to the amount of digoxin an present in the bloodstream at the beginning of the time interval. The slope of
Figure 1.11
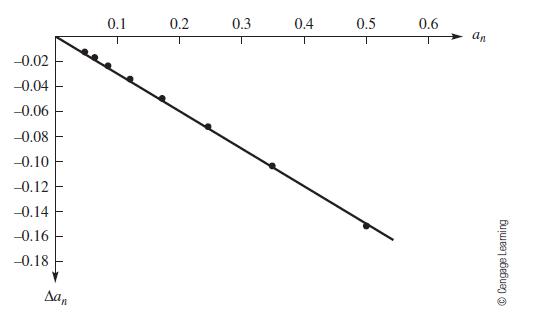
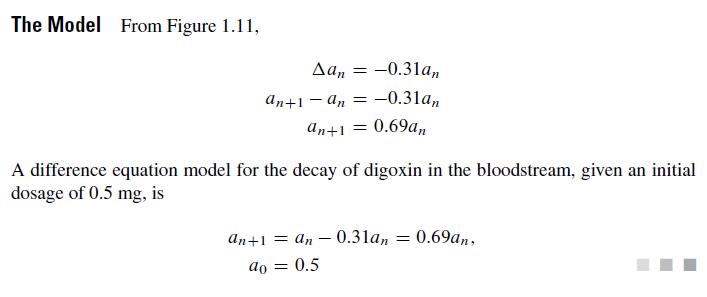
the proportionality line through the origin is approximately k ≈–0.107/0.345≈– 0.310. Since the graph in Figure 1.11 shows the change Δan as a linear function of an with slope –0.31, we have Δan = –0.31an.
Step by Step Answer:
an1 069an 01 ao 05 The equili...View the full answer


A First Course In Mathematical Modeling
ISBN: 9781285050904
5th Edition
Authors: Frank R. Giordano, William P. Fox, Steven B. Horton
