

In the following data, X represents the diameter of a ponderosa pine measured at breast height, and
Question:
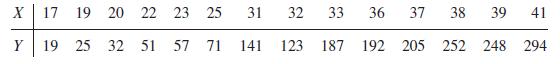
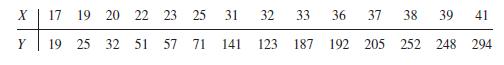
In the following data, X represents the diameter of a ponderosa pine measured at breast height, and Y is a measure of volume—number of board feet divided by 10 (see Problem 4, Section 4.2).
In Problems 6-12, construct a scatterplot of the given data. Is there a trend in the data?
Are any of the data points outliers? Construct a divided difference table. Is smoothing with a low-order polynomial appropriate? If so, choose an appropriate polynomial and fit using the least-squares criterion of best fit. Analyze the goodness of fit by examining appropriate indicators and graphing the model, the data points, and the deviations.
Data from problem 4
In the following data, X represents the diameter of a ponderosa pine measured at breast height, and Y is a measure of volume–number of board feet divided by 10. Make a scatterplot of the data. Discuss the appropriateness of using a 13th-degree polynomial that passes through the data points as an empirical model. If you have a computer available, fit a polynomial to the data and graph the results.
Step by Step Answer:
Negatives appear in the first column of the divided diffe...View the full answer


A First Course In Mathematical Modeling
ISBN: 9781285050904
5th Edition
Authors: Frank R. Giordano, William P. Fox, Steven B. Horton
