

Question: Problem 2 in Section 3.1 Data from problem 2 The following table gives the elongation e in inches per inch (in./in.) for a given stress
Problem 2 in Section 3.1
Data from problem 2
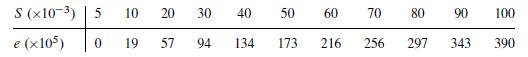
The following table gives the elongation e in inches per inch (in./in.) for a given stress S on a steel wire measured in pounds per square inch (lb/in.2). Test the model e = c1S by plotting the data. Estimate c1 graphically.
For Problems 1-6, find a model using the least-squares criterion either on the data or on the transformed data (as appropriate). Compare your results with the graphical fits obtained in the problem set 3.1 by computing the deviations, the maximum absolute deviation, and the sum of the squared deviations for each model. Find a bound on cmax if the model was fit using the least-squares criterion.
Step by Step Solution
3.25 Rating (154 Votes )
There are 3 Steps involved in it
a e as impl... View full answer

Get step-by-step solutions from verified subject matter experts