

The following data represent the pace of life data (see Problem 1, Section 4.1). P is the
Question:
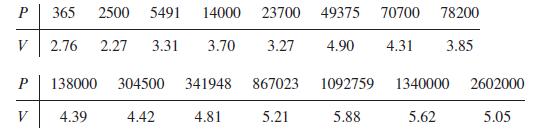
The following data represent the pace of life'' data (see Problem 1, Section 4.1). P is the population and V is the mean velocity in feet per second over a 50-ft course.
In Problems 6-12, construct a scatterplot of the given data. Is there a trend in the data? Are any of the data points outliers? Construct a divided difference table. Is smoothing with a low-order polynomial appropriate? If so, choose an appropriate polynomial and fit using the least-squares criterion of best fit. Analyze the goodness of fit by examining appropriate indicators and graphing the model, the data points, and the deviations.
Data from problem 1
Fit the model V = CPa to the ``pace of life'' data in Table 4.5. Use the transformation log V = a log P + log C. Plot log V versus log P. Does the relationship seem reasonable?
Table 4.5

Step by Step Answer:

This question has not been answered yet.
You can Ask your question!


A First Course In Mathematical Modeling
ISBN: 9781285050904
5th Edition
Authors: Frank R. Giordano, William P. Fox, Steven B. Horton
