

The following data represent the pace of life (see Problem 1, Section 4.1). P is the population
Question:
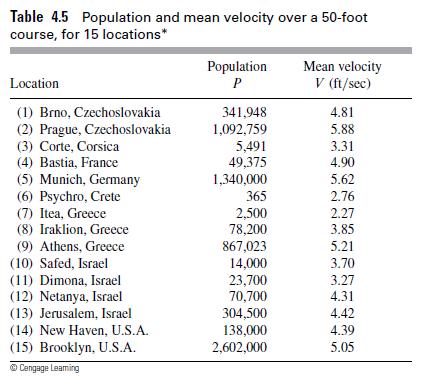
The following data represent the pace of life (see Problem 1, Section 4.1). P is the population and V is the mean velocity in feet per second over a 50-ft course.
For Projects 2-9, use the software you developed in Project 1 to find the splines that pass through the given data points. Use graphics software, if available, to sketch the resulting splines.
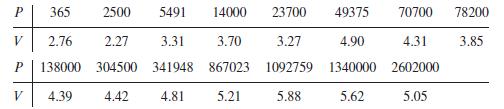
Data from problem 1
Fit the model V = CPa to the ``pace of life'' data in Table 4.5. Use the transformation log V = a log P + log C. Plot log V versus log P. Does the relationship seem reasonable?
Table 4.5
Fantastic news! We've Found the answer you've been seeking!
Step by Step Answer:
Based on the data provided and the instructions it seems like there are two tasks here 1 Fitting the model V CPa to the pace of life data To fit the m...View the full answer

Answered By
Joseph Mwaura
I have been teaching college students in various subjects for 9 years now. Besides, I have been tutoring online with several tutoring companies from 2010 to date. The 9 years of experience as a tutor has enabled me to develop multiple tutoring skills and see thousands of students excel in their education and in life after school which gives me much pleasure. I have assisted students in essay writing and in doing academic research and this has helped me be well versed with the various writing styles such as APA, MLA, Chicago/ Turabian, Harvard. I am always ready to handle work at any hour and in any way as students specify. In my tutoring journey, excellence has always been my guiding standard.
1+ Reviews
10+ Question Solved
Related Book For 

A First Course In Mathematical Modeling
ISBN: 9781285050904
5th Edition
Authors: Frank R. Giordano, William P. Fox, Steven B. Horton
Question Posted:
