

Question: Using the data, a calculator, and the model you determined for V (Problem 1f), complete Table 4.6. Table 4.6 Data from problem 1f Fit the
Using the data, a calculator, and the model you determined for V (Problem 1f), complete Table 4.6.
Table 4.6
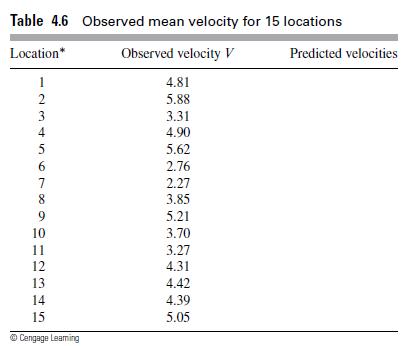
Data from problem 1f
Fit the model V = CPa to the ``pace of life'' data in Table 4.5. Use the transformation log V = a log P + log C. Plot log V versus log P. Does the relationship seem reasonable?
f. Find the equation of the form V = CPa that expresses V in terms of P. In 1976, Marc and Helen Bornstein studied the pace of life.2 To see if life becomes more hectic as the size of the city becomes larger, they systematically observed the mean time required for pedestrians to walk 50 feet on the main streets of their cities and towns. In Table 4.5, we present some of the data they collected. The variable P represents the population of the town or city, and the variable V represents the mean velocity of pedestrians walking the 50 feet. Problems 1-5 are based on the data in Table 4.5.
Table 4.5
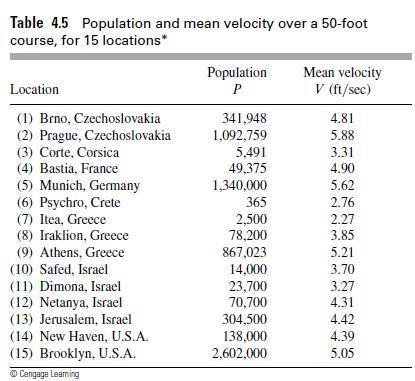
Table 4.6 Observed mean velocity for 15 locations Location* Observed velocity V 12345 3 4 6 7 8 9 10 11 12 13 14 15 Cengage Leaming 4.81 5.88 3.31 4.90 5.62 2.76 2.27 3.85 5.21 3.70 3.27 4.31 4.42 4.39 5.05 Predicted velocities
Step by Step Solution
3.38 Rating (154 Votes )
There are 3 Steps involved in it

Get step-by-step solutions from verified subject matter experts