

Question: Solve Problems 1-4 with the model V = m(logP) + b. Compare the errors with those computed in Problem 4. Compare the two models. Which
Solve Problems 1-4 with the model V = m(logP) + b. Compare the errors with those computed in Problem 4. Compare the two models. Which is better?
Data from problem 4
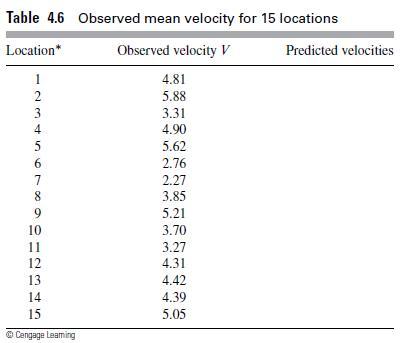
From the data in Table 4.6, calculate the mean (i.e., the average) of the Bornstein errors ∣Vobserved – Vpredicted∣. What do the results suggest about the merit of the model?
Table 4.6
In 1976, Marc and Helen Bornstein studied the pace of life.2 To see if life becomes more hectic as the size of the city becomes larger, they systematically observed the mean time required for pedestrians to walk 50 feet on the main streets of their cities and towns. In Table 4.5, we present some of the data they collected. The variable P represents the population of the town or city, and the variable V represents the mean velocity of pedestrians walking the 50 feet. Problems 1-5 are based on the data in Table 4.5.
Table 4.5
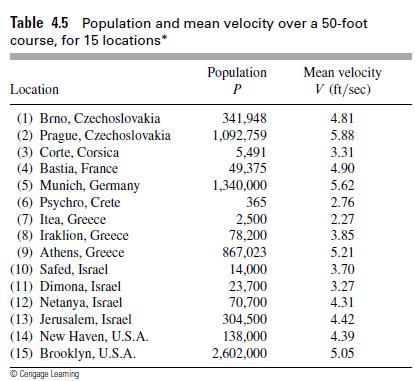
Table 4.6 Observed mean velocity for 15 locations Observed velocity V Location* 1 -23456789DHDBAS 10 11 12 13 14 15 Cengage Leaming 4.81 5.88 3.31 4.90 5.62 2.76 2.27 3.85 5.21 3.70 3.27 4.31 4.42 4.39 5.05 Predicted velocities
Step by Step Solution
3.38 Rating (139 Votes )
There are 3 Steps involved in it

Get step-by-step solutions from verified subject matter experts