

How can you determine whether a distribution is approximately normal? A statistical theorem called Chebyshevs theorem states
Question:
How can you determine whether a distribution is approximately normal? A statistical theorem called Chebyshev’s theorem states that the minimum percent of data between plus and minus K standard deviations from the mean (K > 1) in any distribution can be determined by the formula
Minimum percent = 1 - 1/K2
Thus, for example, between {2 standard deviations from the mean there will always be a minimum of 75% of data. This minimum percent applies to any distribution. For K = 2,
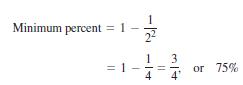
Likewise, between {3 standard deviations from the mean there will always be a minimum of 89% of the data. For K = 3,
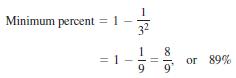
The following table lists the minimum percent of data in any distribution and the actual percent of data in the normal distribution between ±1.1, ±1.5, ±2.0, and ±2.5 standard deviations from the mean. The minimum percents of data in any distribution were calculated by using Chebyshev’s theorem. The actual percents of data for the normal distribution were calculated by using the area given in the standard normal, or z, table.
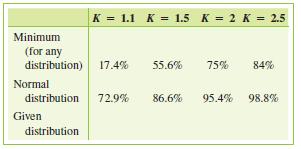
The percentages for the third row of the chart will be calculated in part (d).
Consider the following 30 pieces of data obtained from a quiz.
1, 1, 1, 1, 2, 2, 2, 2, 3, 3, 4, 4, 4, 5, 6,
6, 6, 7, 7, 7, 7, 8, 8, 8, 8, 9, 9, 9, 10, 10
a) Determine the mean of the set of scores.
b) Determine the standard deviation of the set of scores.
c) Determine the values that correspond to 1.1, 1.5, 2.0, and 2.5 standard deviations above the mean. Then determine the values that correspond to 1.1, 1.5, 2.0, and 2.5 standard deviations below the mean.
d) By observing the 30 pieces of data, determine the actual percent of quiz scores between
±1.1 standard deviations from the mean.
±1.5 standard deviations from the mean.
±2 standard deviations from the mean.
±2.5 standard deviations from the mean.
e) Place the percents determined in part (d) in the third row of the chart.
f) Compare the percents in the third row of the chart with the minimum percents in the first row and the normal percents in the second row, and then make a judgment as to whether this set of 30 scores is approximately normally distributed.
Step by Step Answer:
a x 16030 533 b c x 11s 533 11300 203 x 15s 533 15300 083 x 20s 533 20300 067 x 25s 533 ...View the full answer


A Survey Of Mathematics With Applications
ISBN: 9780135740460
11th Edition
Authors: Allen R. Angel, Christine D. Abbott, Dennis Runde
