

The following graph was created using Stat Crunch with data from AutomobileMag.com. The graph shows U.S. automobile
Question:
The following graph was created using Stat Crunch with data from AutomobileMag.com. The graph shows U.S. automobile sales, in automobiles sold, by manufacturer, for the year 2018. The total sales for the year 2018 were 17,300,000 automobiles.
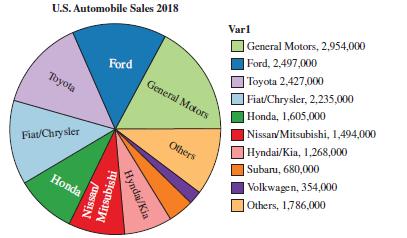
If an automobile is sold in the United States, determine the empirical probability that the automobile sold is manufactured by
a) General Motors.
b) A manufacturer other than General Motors.
c) Honda.
d) A manufacturer other than Honda.
Write your answer as a decimal number rounded to four decimal places. In each exercise, assume the trend continues.
Fantastic news! We've Found the answer you've been seeking!
Step by Step Answer:
a b Pnot General Motors 10...View the full answer

Answered By
Rajat Gupta
used to take tution classes from my school time.
Conducted special topic claases during my graduation to help the students pass their exams.
Currently, teaching and conducting online claases during my post- graduation too.
1+ Reviews
10+ Question Solved
Related Book For 

A Survey Of Mathematics With Applications
ISBN: 9780135740460
11th Edition
Authors: Allen R. Angel, Christine D. Abbott, Dennis Runde
Question Posted:
