

The graph was created using Stat Crunch with data obtained from AccuWeather.com. The graph indicates the hourly
Question:
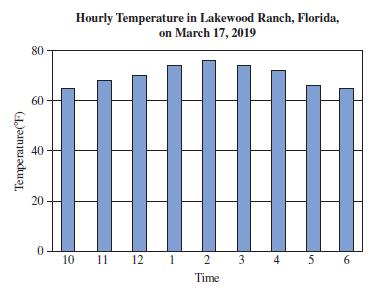
The graph was created using Stat Crunch with data obtained from AccuWeather.com. The graph indicates the hourly temperature, in degrees Fahrenheit, in Lakewood Ranch, Florida, from 10 a.m. to 6 p.m. on Sunday, March 17, 2019. The quadratic function t(x) = -0.65x2 + 5.16x + 64.42 can be used to estimate the hourly temperature, where x is the number of hours since 10 a.m. and 0 ≤ x ≤ 8.
a) Use the function t(x) to estimate the temperature in Lakewood Ranch at 1 p.m. Round your answer to the nearest degree.
b) Use the graph to determine the hour that the temperature was a maximum.
c) Determine the x-coordinate of the vertex of the graph of t(x). Then use this value in t(x) to estimate the maximum temperature. Round your value of x to the nearest hour. Round your answer for the temperature to the nearest degree.
Step by Step Answer:
a t3 0653 2 5163 6442 ...View the full answer


A Survey Of Mathematics With Applications
ISBN: 9780135740460
11th Edition
Authors: Allen R. Angel, Christine D. Abbott, Dennis Runde
