

Question: Amazon.com, Inc.'s financial statements are presented in Appendix D. Financial statements of Walmart Inc. are presented in Appendix E. The complete annual reports of Amazon
Amazon.com, Inc.'s financial statements are presented in Appendix D.
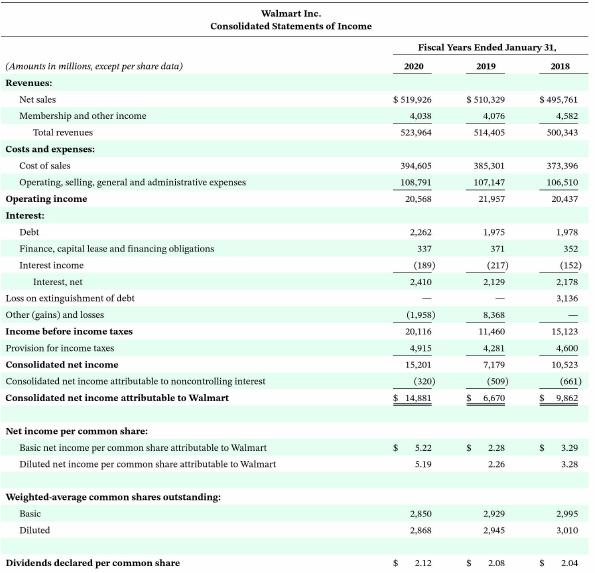
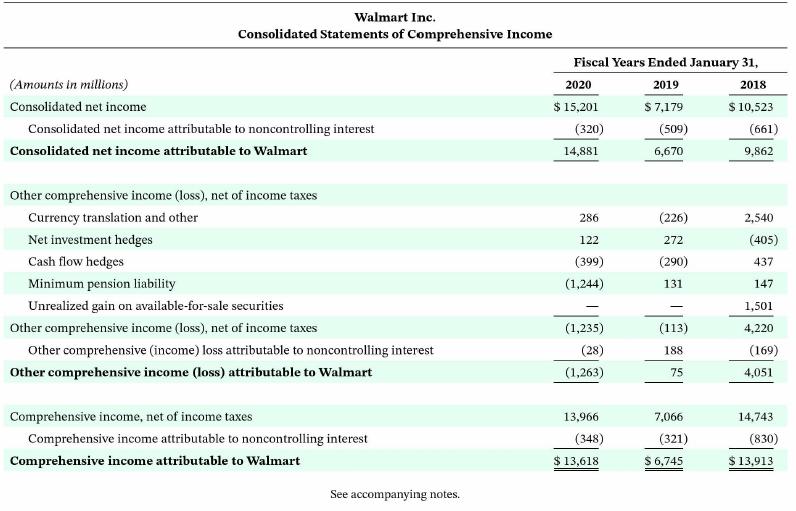
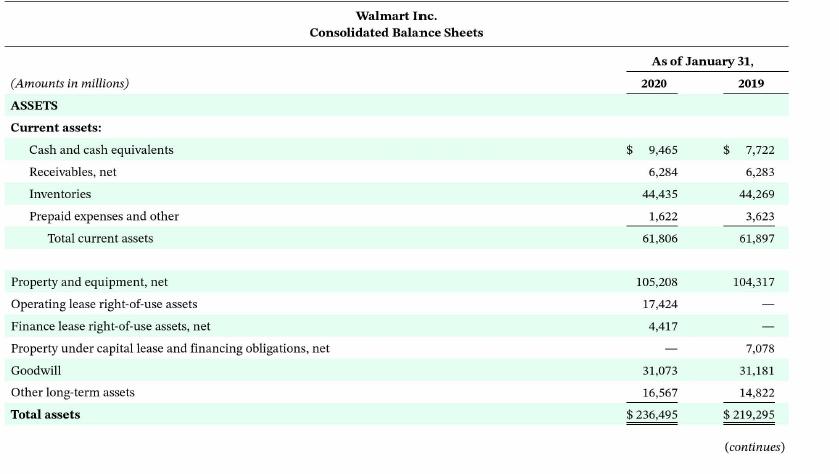
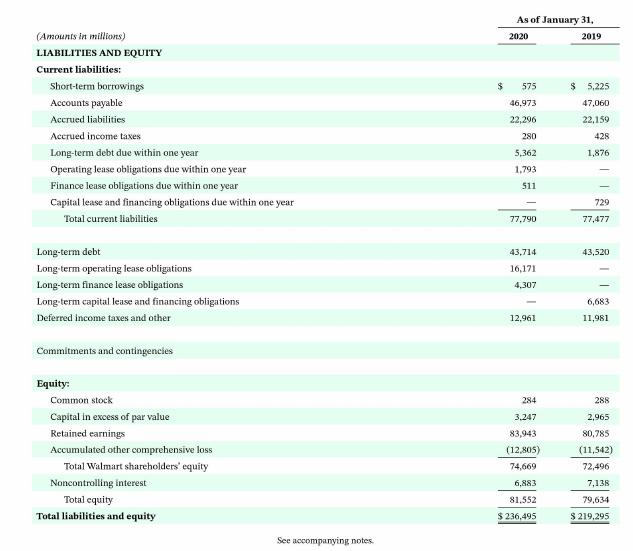
Financial statements of Walmart Inc. are presented in Appendix E.
The complete annual reports of Amazon and Walmart including the notes to the financial statements, are available at each company's respective website.
Instructions
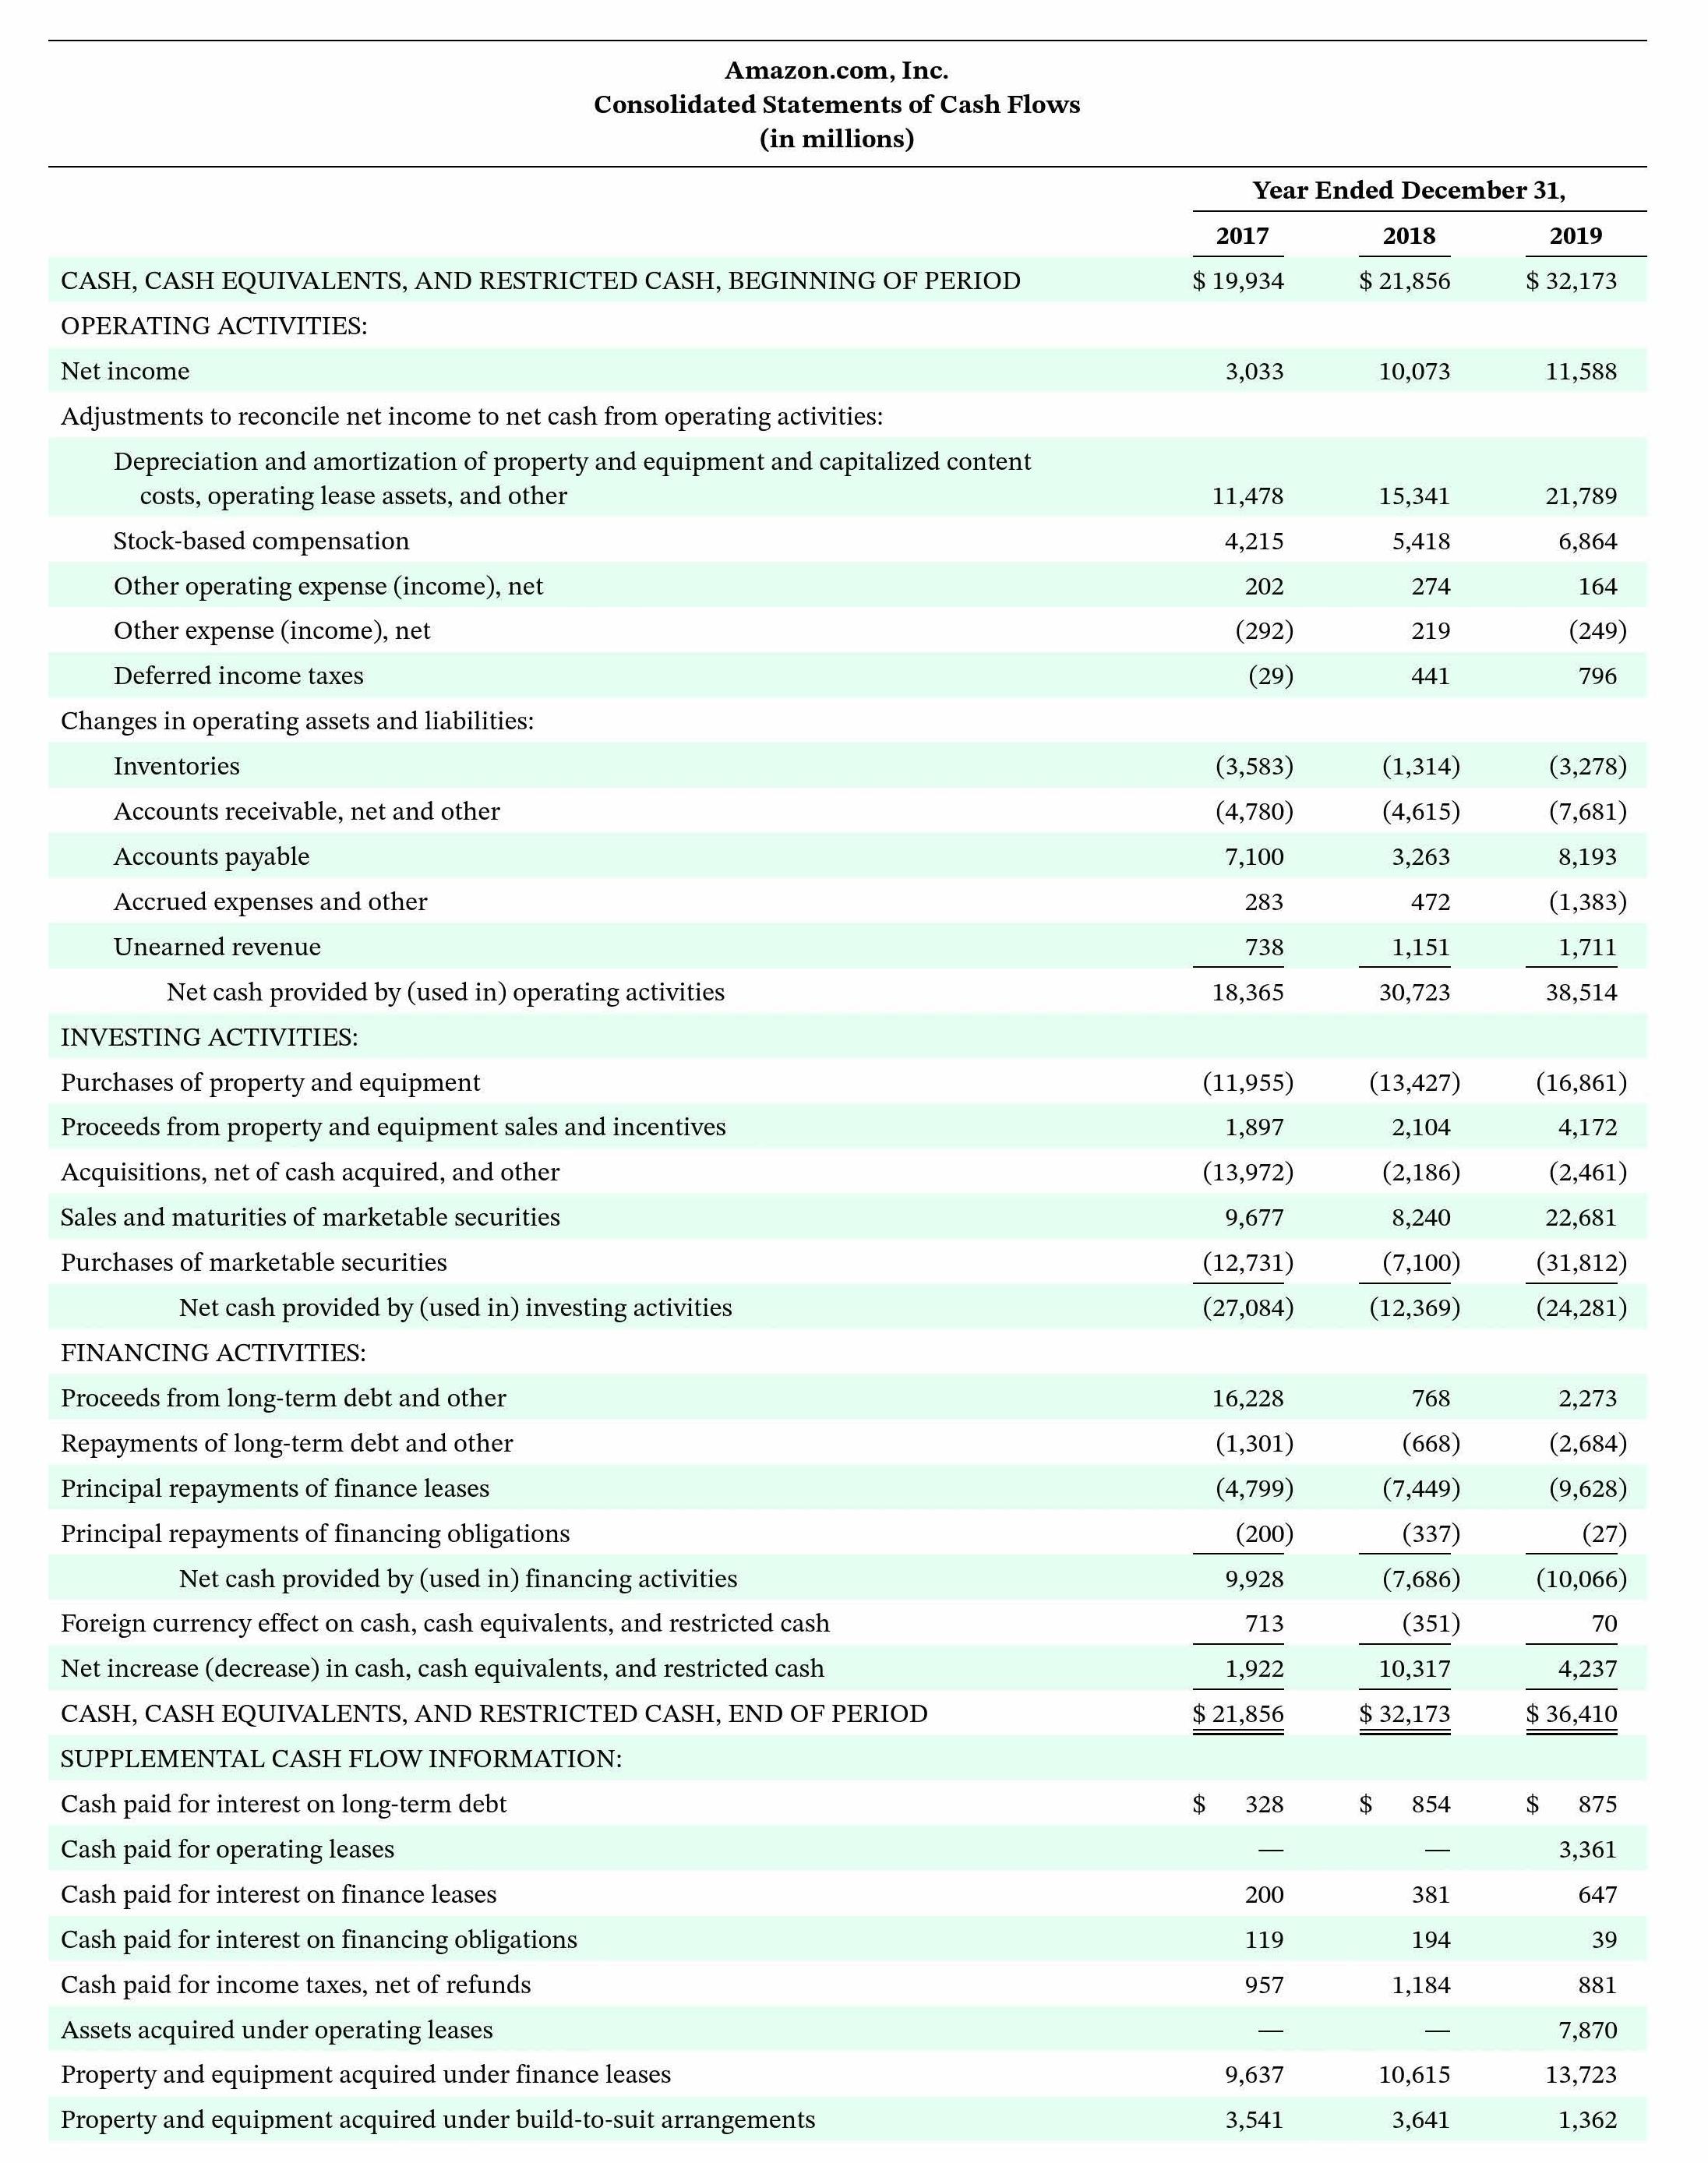
Based on the information contained in these financial statements, determine the net cash used in investing activities for each company.
CASH, CASH EQUIVALENTS, AND RESTRICTED CASH, BEGINNING OF PERIOD OPERATING ACTIVITIES: Net income Adjustments to reconcile net income to net cash from operating activities: Depreciation and amortization of property and equipment and capitalized content costs, operating lease assets, and other Stock-based compensation Other operating expense (income), net Other expense (income), net Deferred income taxes Changes in operating assets and liabilities: Inventories Accounts receivable, net and other Accounts payable Accrued expenses and other Unearned revenue Net cash provided by (used in) operating activities Amazon.com, Inc. Consolidated Statements of Cash Flows (in millions) INVESTING ACTIVITIES: Purchases of property and equipment Proceeds from property and equipment sales and incentives Acquisitions, net of cash acquired, and other Sales and maturities of marketable securities Purchases of marketable securities Net cash provided by (used in) investing activities FINANCING ACTIVITIES: Proceeds from long-term debt and other Repayments of long-term debt and other Principal repayments of finance leases Principal repayments of financing obligations Net cash provided by (used in) financing activities Foreign currency effect on cash, cash equivalents, and restricted cash Net increase (decrease) in cash, cash equivalents, and restricted cash CASH, CASH EQUIVALENTS, AND RESTRICTED CASH, END OF PERIOD SUPPLEMENTAL CASH FLOW INFORMATION: Cash paid for interest on long-term debt Cash paid for operating leases Cash paid for interest on finance leases Cash paid for interest on financing obligations Cash paid for income taxes, net of refunds Assets acquired under operating leases Property and equipment acquired under finance leases Property and equipment acquired under build-to-suit arrangements Year Ended December 31, 2017 $ 19,934 3,033 $ 11,478 4,215 202 (292) (29) (3,583) (4,780) 7,100 283 738 18,365 (11,955) 1,897 (13,972) 9,677 (12,731) (27,084) 16,228 (1,301) (4,799) (200) 9,928 713 1,922 $ 21,856 328 200 119 957 9,637 3,541 2018 $ 21,856 10,073 15,341 5,418 274 219 441 $ (1,314) (4,615) 3,263 472 1,151 30,723 (13,427) 2,104 (2,186) 8,240 (7,100) (12,369) 768 (668) (7,449) (337) (7,686) (351) 10,317 $ 32,173 854 381 194 1,184 10,615 3,641 2019 $32,173 11,588 21,789 6,864 164 (249) 796 $ (3,278) (7,681) 8,193 (1,383) 1,711 38,514 (16,861) 4,172 (2,461) 22,681 (31,812) (24,281) 2,273 (2,684) (9,628) (27) (10,066) 70 4,237 $36,410 875 3,361 647 39 881 7,870 13,723 1,362
Step by Step Solution
3.47 Rating (170 Votes )
There are 3 Steps involved in it
in millions Am... View full answer

Get step-by-step solutions from verified subject matter experts