

Question: Selected hypothetical comparative financial data (in thousands, except for share price) for Cineplex Inc. are shown below. Instructions a. Calculate the following ratios for 2024:
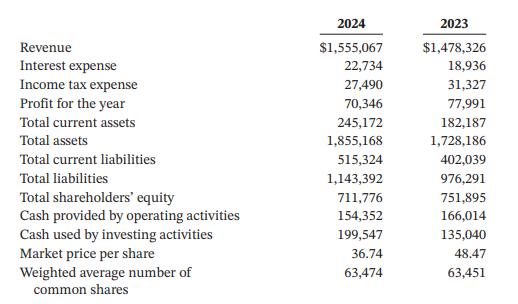
Selected hypothetical comparative financial data (in thousands, except for share price) for Cineplex Inc. are shown below.
Instructions
a. Calculate the following ratios for 2024:
1. Asset turnover
2. Current ratio
3. Debt to total assets
4. Earnings per share
5. Free cash flow
6. Interest coverage
7. Price-earnings ratio
8. Profit margin
9. Return on assets
10. Return on equity
b. Indicate whether each of the above ratios is a measure of liquidity (L), solvency (S), or profitability (P).
Revenue Interest expense Income tax expense Profit for the year Total current assets Total assets Total current liabilities Total liabilities Total shareholders' equity Cash provided by operating activities Cash used by investing activities Market price per share Weighted average number of common shares 2024 $1,555,067 22,734 27,490 70,346 245,172 1,855,168 515,324 1,143,392 711,776 154,352 199,547 36.74 63,474 2023 $1,478,326 18,936 31,327 77,991 182,187 1,728,186 402,039 976,291 751,895 166,014 135,040 48.47 63,451
Step by Step Solution
3.26 Rating (152 Votes )
There are 3 Steps involved in it
a b in thousands except for share price a 1 2 3 4 5 6 Asset turnov... View full answer

Get step-by-step solutions from verified subject matter experts